

Corak sebenar

Bearish pennant
was formed on 27.03 at 16:26:41 (UTC+0)
signal strength 1 of 5
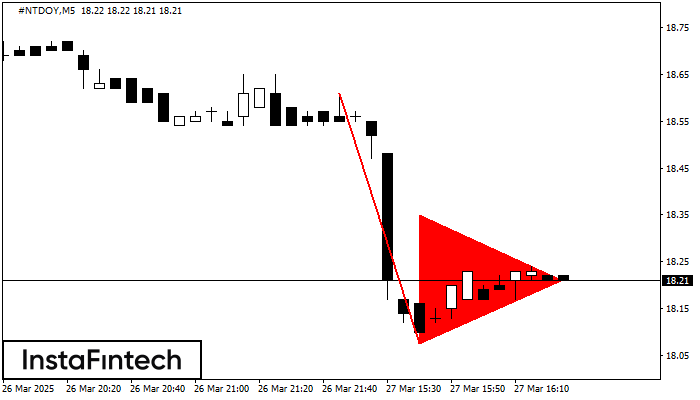
The Bearish pennant pattern has formed on the #NTDOY M5 chart. It signals potential continuation of the existing trend. Specifications: the pattern’s bottom has the coordinate of 18.08; the projection of the flagpole height is equal to 53 pips. In case the price breaks out the pattern’s bottom of 18.08, the downtrend is expected to continue for further level 17.93.
The M5 and M15 time frames may have more false entry points.
Juga lihat
- All
- All
- Bearish Rectangle
- Bearish Symmetrical Triangle
- Bearish Symmetrical Triangle
- Bullish Rectangle
- Double Top
- Double Top
- Triple Bottom
- Triple Bottom
- Triple Top
- Triple Top
- All
- All
- Buy
- Sale
- All
- 1
- 2
- 3
- 4
- 5
Double Bottom
was formed on 02.04 at 11:20:53 (UTC+0)
signal strength 1 of 5

Corak Double Bottom telah dibentuk pada EURNZD M5. Ciri-ciri: tahap sokongan 1.8799; tahap rintangan 1.8817; lebar corak 18 mata. Sekiranya tahap rintangan ditembusi, perubahan aliran boleh diramalkan dengan titik sasaran
Carta masa M5 dan M15 mungkin mempunyai lebih banyak titik kemasukan palsu.
Open chart in a new window
Inverse Head dan Shoulder
was formed on 02.04 at 11:00:29 (UTC+0)
signal strength 4 of 5
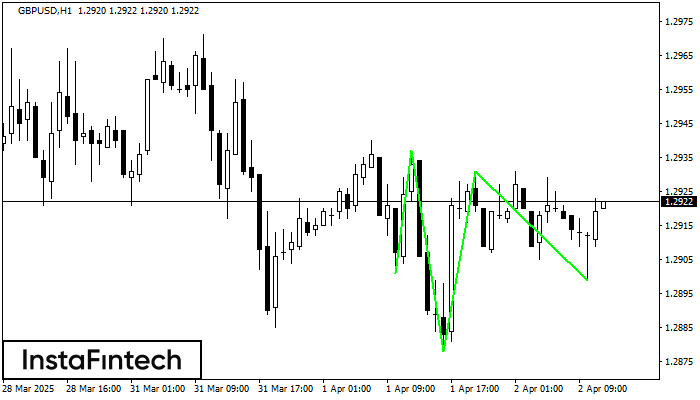
According to H1, GBPUSD is shaping the technical pattern – the Inverse Head dan Shoulder. In case the Neckline 1.2937/1.2931 is broken out, the instrument is likely to move toward
Open chart in a new window
Double Bottom
was formed on 02.04 at 11:00:06 (UTC+0)
signal strength 4 of 5
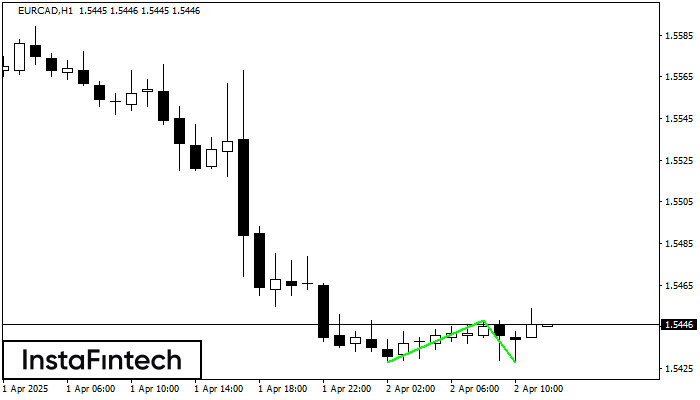
Corak Double Bottom telah dibentuk pada EURCAD H1; sempadan atas adalah 1.5448; sempadan bawah adalah 1.5428. Lebar corak adalah 20 mata. Sekiranya penembusan sempadan atas 1.5448, perubahan aliran boleh diramalkan
Open chart in a new window


