

Corak sebenar

Bullish Rectangle
was formed on 24.03 at 10:01:59 (UTC+0)
signal strength 1 of 5
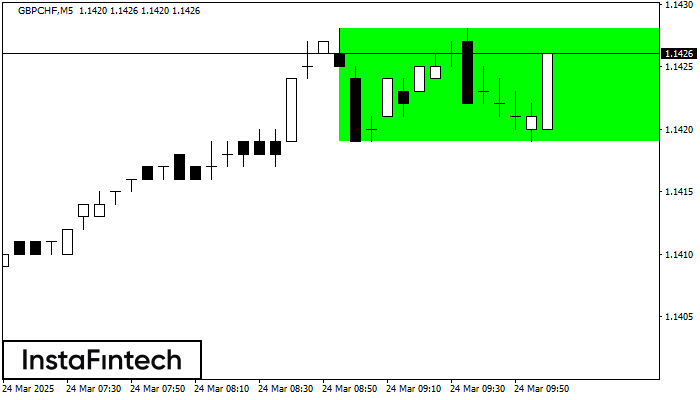
According to the chart of M5, GBPCHF formed the Bullish Rectangle which is a pattern of a trend continuation. The pattern is contained within the following borders: the lower border 1.1419 – 1.1419 and upper border 1.1428 – 1.1428. In case the upper border is broken, the instrument is likely to follow the upward trend.
The M5 and M15 time frames may have more false entry points.
Juga lihat
- All
- All
- Bearish Rectangle
- Bearish Symmetrical Triangle
- Bearish Symmetrical Triangle
- Bullish Rectangle
- Double Top
- Double Top
- Triple Bottom
- Triple Bottom
- Triple Top
- Triple Top
- All
- All
- Buy
- Sale
- All
- 1
- 2
- 3
- 4
- 5
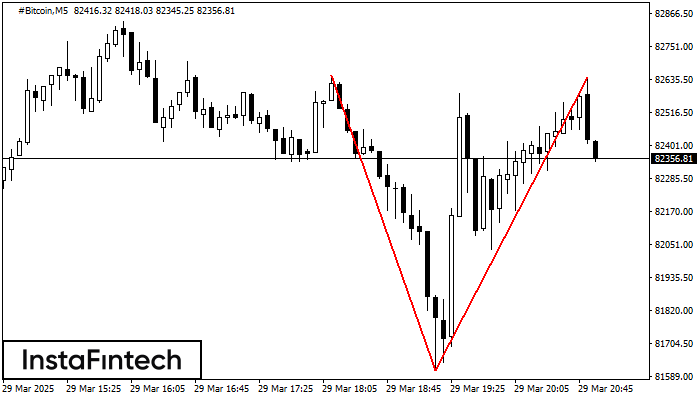
ट्रिपल टॉप
was formed on 29.03 at 23:35:32 (UTC+0)
signal strength 1 of 5

ट्रिपल टॉप पैटर्न #Bitcoin M5 ट्रेडिंग इंस्ट्रूमेंट के चार्ट पर बना है। यह एक रीवर्सल पैटर्न है जिसमें निम्नलिखित विशेषताएं हैं: प्रतिरोध स्तर 50, समर्थन स्तर -21012, और पैटर्न की
M5 और M15 समय सीमा में अधिक फाल्स एंट्री पॉइंट्स हो सकते हैं।
Open chart in a new window
इन्वर्स हेड एण्ड शोल्डर्स
was formed on 29.03 at 22:00:17 (UTC+0)
signal strength 2 of 5

M15 के चार्ट के अनुसार, #Bitcoin से इन्वर्स हेड एण्ड शोल्डर्स पैटर्न बना। हेड 81609.29 पर स्थित है जबकि नेक की मध्य रेखा 82839.07/82640.15 पर सेट है। इन्वर्स हेड एण्ड
M5 और M15 समय सीमा में अधिक फाल्स एंट्री पॉइंट्स हो सकते हैं।
Open chart in a new window
डबल टॉप
was formed on 29.03 at 20:55:27 (UTC+0)
signal strength 1 of 5
#Bitcoin M5 पर डबल टॉप रीवर्सल पैटर्न बना है। विशेषताएं: ऊपरी सीमा 82648.20; निचली सीमा 81609.29; पैटर्न की चौड़ाई 103086 पॉइंट्स है। सेल ट्रेडों को 81609.29 की निचली सीमा के
M5 और M15 समय सीमा में अधिक फाल्स एंट्री पॉइंट्स हो सकते हैं।
Open chart in a new window


