

Corak sebenar

Bearish pennant
was formed on 21.03 at 17:30:24 (UTC+0)
signal strength 2 of 5
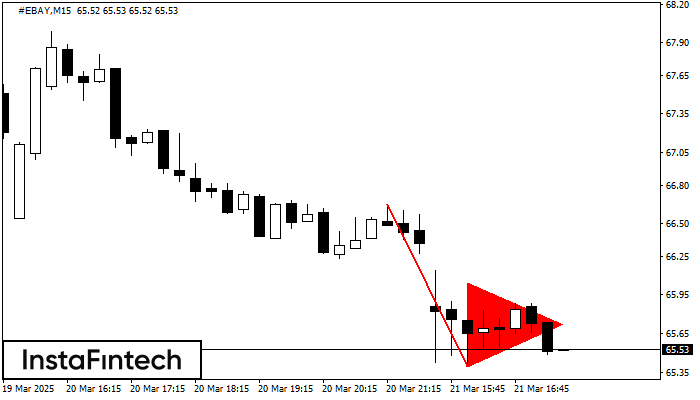
The Bearish pennant pattern has formed on the #EBAY M15 chart. It signals potential continuation of the existing trend. Specifications: the pattern’s bottom has the coordinate of 65.40; the projection of the flagpole height is equal to 125 pips. In case the price breaks out the pattern’s bottom of 65.40, the downtrend is expected to continue for further level 65.18.
The M5 and M15 time frames may have more false entry points.
Juga lihat
- All
- All
- Bearish Rectangle
- Bearish Symmetrical Triangle
- Bearish Symmetrical Triangle
- Bullish Rectangle
- Double Top
- Double Top
- Triple Bottom
- Triple Bottom
- Triple Top
- Triple Top
- All
- All
- Buy
- Sale
- All
- 1
- 2
- 3
- 4
- 5
Double Top
was formed on 26.03 at 05:30:20 (UTC+0)
signal strength 3 of 5
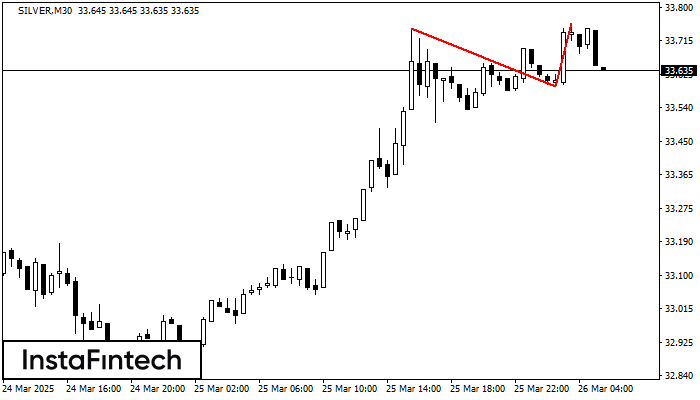
On the chart of SILVER M30 the Double Top reversal pattern has been formed. Characteristics: the upper boundary 33.76; the lower boundary 33.59; the width of the pattern 165 points
Open chart in a new window
Double Bottom
was formed on 26.03 at 05:00:29 (UTC+0)
signal strength 4 of 5
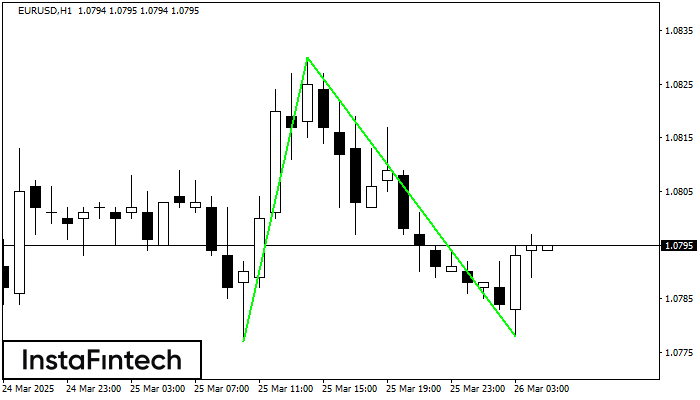
The Double Bottom pattern has been formed on EURUSD H1; the upper boundary is 1.0830; the lower boundary is 1.0778. The width of the pattern is 53 points. In case
Open chart in a new window
Double Bottom
was formed on 26.03 at 05:00:28 (UTC+0)
signal strength 4 of 5
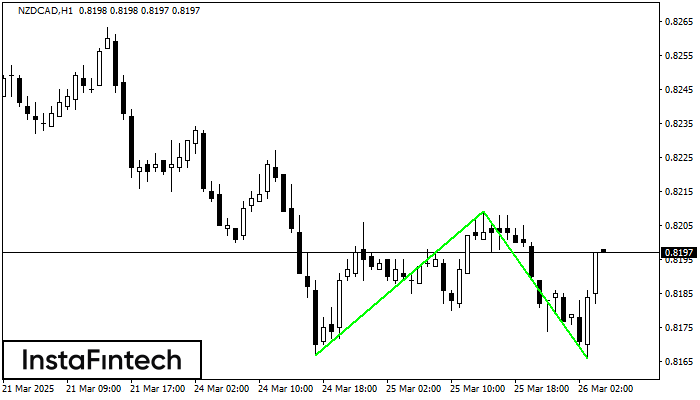
The Double Bottom pattern has been formed on NZDCAD H1; the upper boundary is 0.8209; the lower boundary is 0.8166. The width of the pattern is 42 points. In case
Open chart in a new window


