

Corak sebenar

Bullish Symmetrical Triangle
was formed on 21.03 at 01:25:44 (UTC+0)
signal strength 1 of 5
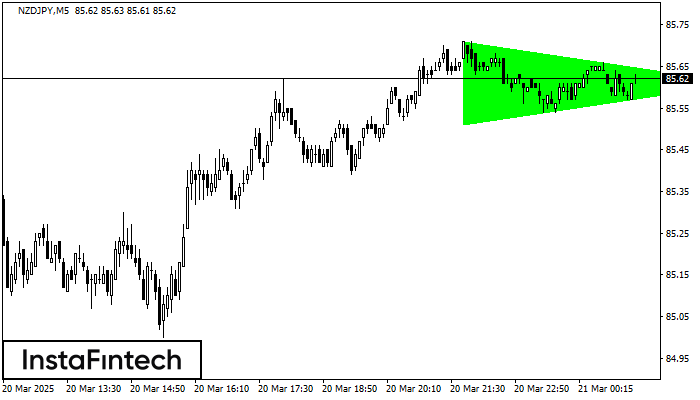
According to the chart of M5, NZDJPY formed the Bullish Symmetrical Triangle pattern. Description: This is the pattern of a trend continuation. 85.71 and 85.51 are the coordinates of the upper and lower borders respectively. The pattern width is measured on the chart at 20 pips. Outlook: If the upper border 85.71 is broken, the price is likely to continue its move by 85.76.
The M5 and M15 time frames may have more false entry points.
Juga lihat
- All
- All
- Bearish Rectangle
- Bearish Symmetrical Triangle
- Bearish Symmetrical Triangle
- Bullish Rectangle
- Double Top
- Double Top
- Triple Bottom
- Triple Bottom
- Triple Top
- Triple Top
- All
- All
- Buy
- Sale
- All
- 1
- 2
- 3
- 4
- 5
Double Top
was formed on 26.03 at 05:30:20 (UTC+0)
signal strength 3 of 5
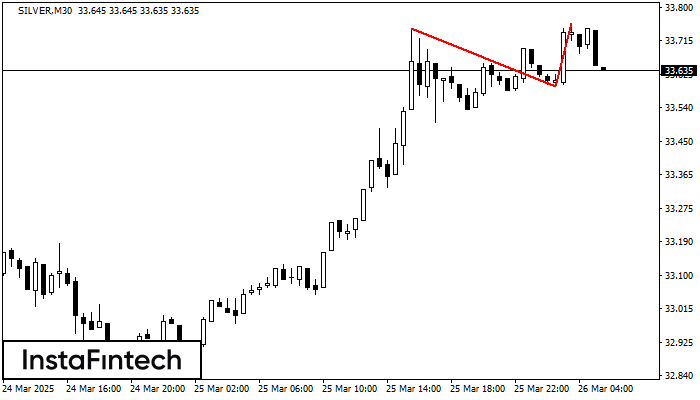
Pada carta SILVER M30 corak pembalikan Double Top telah terbentuk. Ciri-ciri: sempadan atas 33.76; sempadan bawah 33.59; lebar corak 165 mata. Isyarat: penembusan sempadan bawah akan menyebabkan kesinambungan arah aliran
Open chart in a new window
Double Bottom
was formed on 26.03 at 05:00:29 (UTC+0)
signal strength 4 of 5
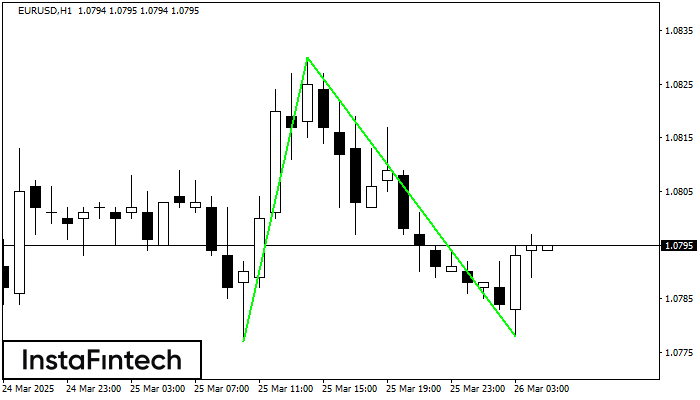
Corak Double Bottom telah dibentuk pada EURUSD H1; sempadan atas adalah 1.0830; sempadan bawah adalah 1.0778. Lebar corak adalah 53 mata. Sekiranya penembusan sempadan atas 1.0830, perubahan aliran boleh diramalkan
Open chart in a new window
Double Bottom
was formed on 26.03 at 05:00:28 (UTC+0)
signal strength 4 of 5
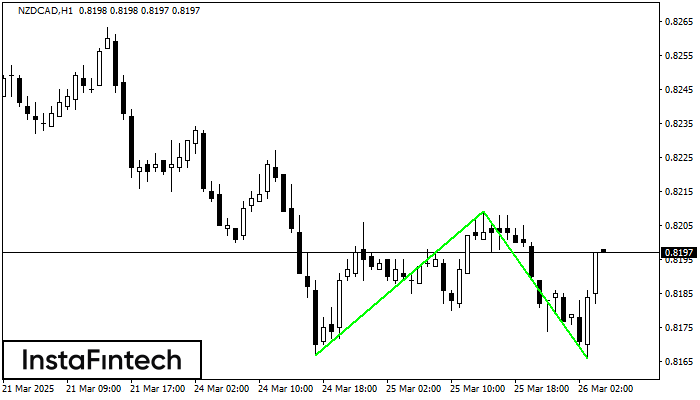
Corak Double Bottom telah dibentuk pada NZDCAD H1; sempadan atas adalah 0.8209; sempadan bawah adalah 0.8166. Lebar corak adalah 42 mata. Sekiranya penembusan sempadan atas 0.8209, perubahan aliran boleh diramalkan
Open chart in a new window


