

Corak sebenar

Head and Shoulders
was formed on 20.03 at 20:30:27 (UTC+0)
signal strength 1 of 5
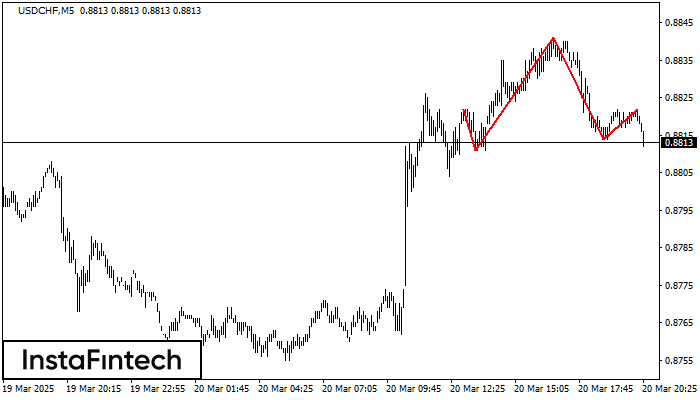
The USDCHF M5 formed the Head and Shoulders pattern with the following features: The Head’s top is at 0.8841, the Neckline and the upward angle are at 0.8811/0.8814. The formation of this pattern can bring about changes in the current trend from bullish to bearish. In case the pattern triggers the expected changes, the price of USDCHF will go towards 0.8799.
The M5 and M15 time frames may have more false entry points.
- All
- All
- Bearish Rectangle
- Bearish Symmetrical Triangle
- Bearish Symmetrical Triangle
- Bullish Rectangle
- Double Top
- Double Top
- Triple Bottom
- Triple Bottom
- Triple Top
- Triple Top
- All
- All
- Buy
- Sale
- All
- 1
- 2
- 3
- 4
- 5
Double Top
was formed on 25.03 at 11:35:26 (UTC+0)
signal strength 1 of 5
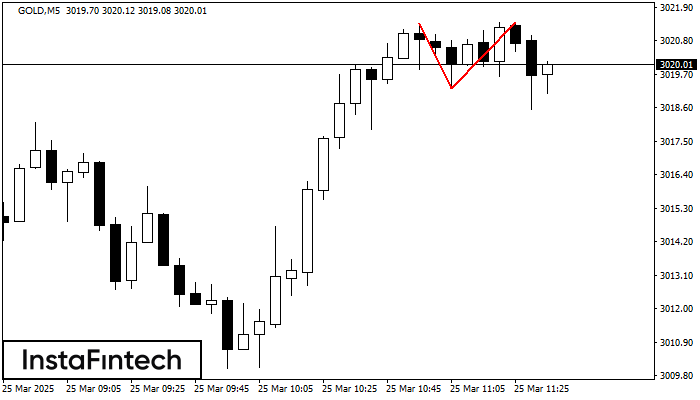
Pada carta GOLD M5 corak pembalikan Double Top telah terbentuk. Ciri-ciri: sempadan atas 3021.40; sempadan bawah 3019.22; lebar corak 218 mata. Isyarat: penembusan sempadan bawah akan menyebabkan kesinambungan arah aliran
Carta masa M5 dan M15 mungkin mempunyai lebih banyak titik kemasukan palsu.
Open chart in a new window
Double Bottom
was formed on 25.03 at 11:30:29 (UTC+0)
signal strength 3 of 5
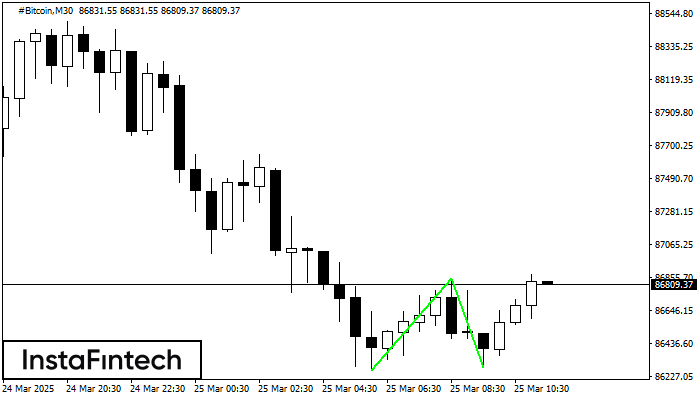
Corak Double Bottom telah dibentuk pada #Bitcoin M30. Pembentukan ini menandakan pembalikan aliran dari aliran menurun ke atas. Isyarat ialah perdagangan membeli harus dibuka selepas sempadan atas corak 86847.43 telah
Open chart in a new window
Double Top
was formed on 25.03 at 10:35:55 (UTC+0)
signal strength 1 of 5
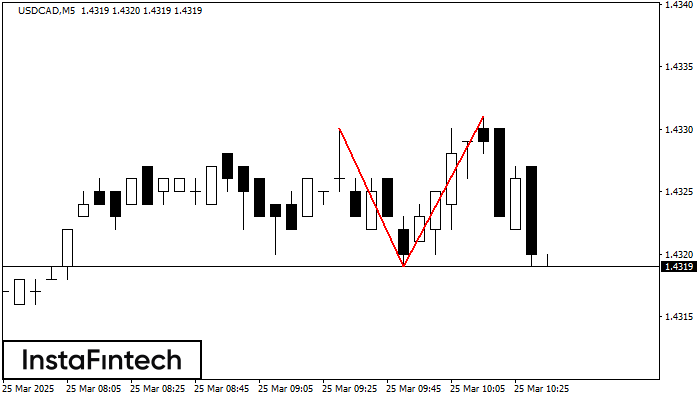
Pada carta USDCAD M5 corak pembalikan Double Top telah terbentuk. Ciri-ciri: sempadan atas 1.4331; sempadan bawah 1.4319; lebar corak 12 mata. Isyarat: penembusan sempadan bawah akan menyebabkan kesinambungan arah aliran
Carta masa M5 dan M15 mungkin mempunyai lebih banyak titik kemasukan palsu.
Open chart in a new window


