

Corak sebenar

Double Bottom
was formed on 20.03 at 19:15:16 (UTC+0)
signal strength 2 of 5
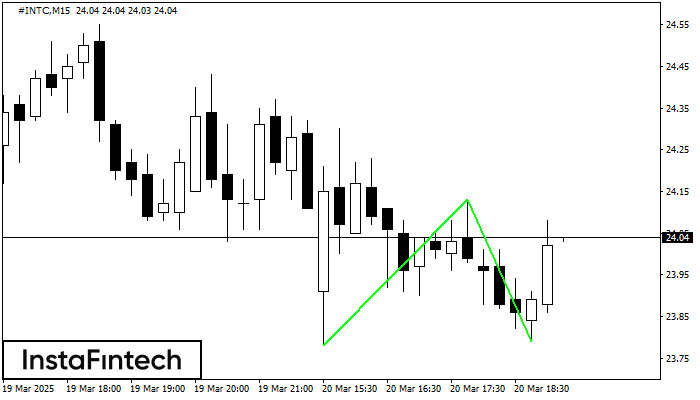
The Double Bottom pattern has been formed on #INTC M15. This formation signals a reversal of the trend from downwards to upwards. The signal is that a buy trade should be opened after the upper boundary of the pattern 24.13 is broken. The further movements will rely on the width of the current pattern 35 points.
The M5 and M15 time frames may have more false entry points.
Juga lihat
- All
- All
- Bearish Rectangle
- Bearish Symmetrical Triangle
- Bearish Symmetrical Triangle
- Bullish Rectangle
- Double Top
- Double Top
- Triple Bottom
- Triple Bottom
- Triple Top
- Triple Top
- All
- All
- Buy
- Sale
- All
- 1
- 2
- 3
- 4
- 5
Double Top
was formed on 25.03 at 11:35:26 (UTC+0)
signal strength 1 of 5
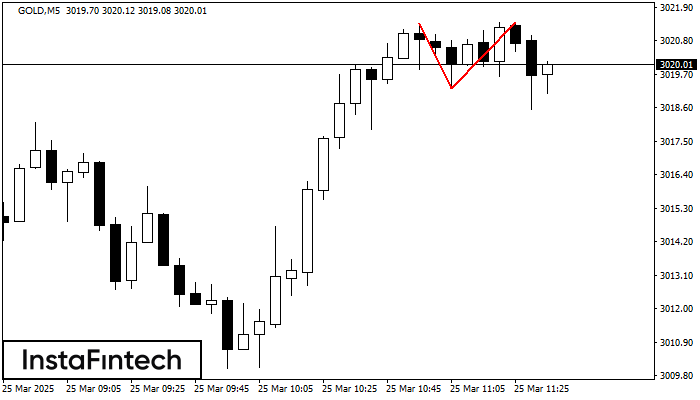
On the chart of GOLD M5 the Double Top reversal pattern has been formed. Characteristics: the upper boundary 3021.40; the lower boundary 3019.22; the width of the pattern 218 points
The M5 and M15 time frames may have more false entry points.
Open chart in a new window
Double Bottom
was formed on 25.03 at 11:30:29 (UTC+0)
signal strength 3 of 5
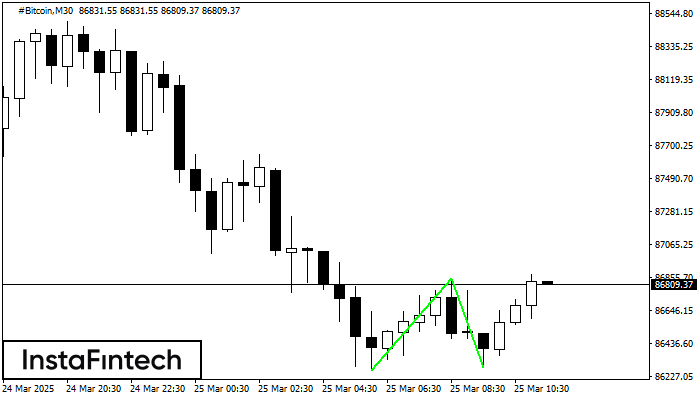
The Double Bottom pattern has been formed on #Bitcoin M30. This formation signals a reversal of the trend from downwards to upwards. The signal is that a buy trade should
Open chart in a new window
Double Top
was formed on 25.03 at 10:35:55 (UTC+0)
signal strength 1 of 5
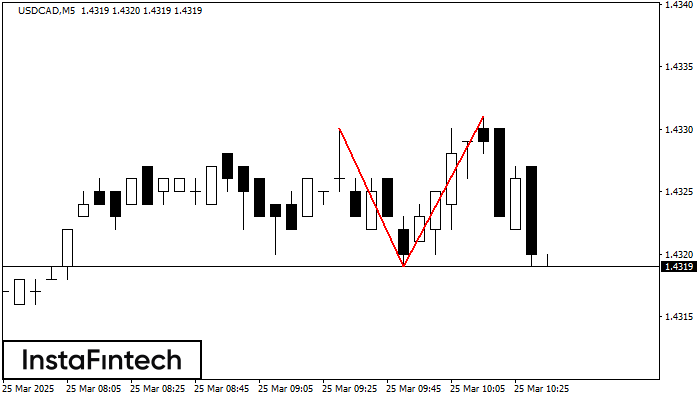
On the chart of USDCAD M5 the Double Top reversal pattern has been formed. Characteristics: the upper boundary 1.4331; the lower boundary 1.4319; the width of the pattern 12 points
The M5 and M15 time frames may have more false entry points.
Open chart in a new window


