

Corak sebenar

Triple Bottom
was formed on 20.03 at 14:50:12 (UTC+0)
signal strength 1 of 5
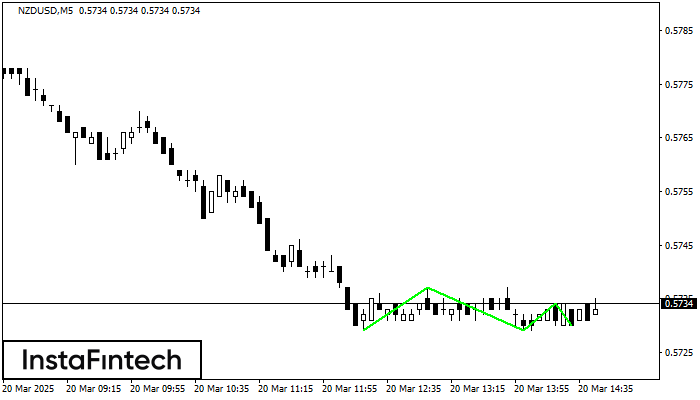
The Triple Bottom pattern has formed on the chart of the NZDUSD M5 trading instrument. The pattern signals a change in the trend from downwards to upwards in the case of breakdown of 0.5737/0.5734.
The M5 and M15 time frames may have more false entry points.
Figure
- All
Instrument
- All
- Bearish Rectangle
- Bearish Symmetrical Triangle
- Bearish Symmetrical Triangle
- Bullish Rectangle
- Double Top
- Double Top
- Triple Bottom
- Triple Bottom
- Triple Top
- Triple Top
Timeframe
- All
Trend
- All
- Buy
- Sale
Signal Strength
- All
- 1
- 2
- 3
- 4
- 5


