

Corak sebenar

Bullish Symmetrical Triangle
was formed on 19.03 at 22:31:16 (UTC+0)
signal strength 1 of 5
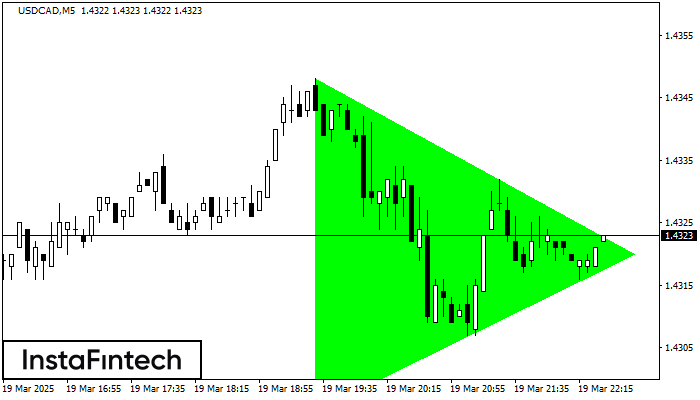
According to the chart of M5, USDCAD formed the Bullish Symmetrical Triangle pattern, which signals the trend will continue. Description. The upper border of the pattern touches the coordinates 1.4348/1.4320 whereas the lower border goes across 1.4295/1.4320. The pattern width is measured on the chart at 53 pips. If the Bullish Symmetrical Triangle pattern is in progress during the upward trend, this indicates the current trend will go on. In case 1.4320 is broken, the price could continue its move toward 1.4335.
The M5 and M15 time frames may have more false entry points.
- All
- All
- Bearish Rectangle
- Bearish Symmetrical Triangle
- Bearish Symmetrical Triangle
- Bullish Rectangle
- Double Top
- Double Top
- Triple Bottom
- Triple Bottom
- Triple Top
- Triple Top
- All
- All
- Buy
- Sale
- All
- 1
- 2
- 3
- 4
- 5
Double Top
was formed on 20.03 at 17:34:58 (UTC+0)
signal strength 1 of 5
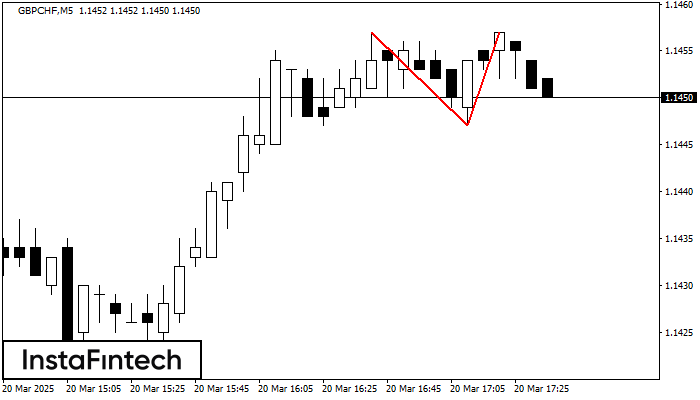
Corak Double Top telah dibentuk pada GBPCHF M5. Isyarat bahawa aliran telah berubah dari aliran menaik ke aliran menurun. Mungkin, sekiranya asas corak 1.1447 ditembusi, pergerakan menurun akan berterusan
Carta masa M5 dan M15 mungkin mempunyai lebih banyak titik kemasukan palsu.
Open chart in a new window
Double Bottom
was formed on 20.03 at 16:59:48 (UTC+0)
signal strength 3 of 5
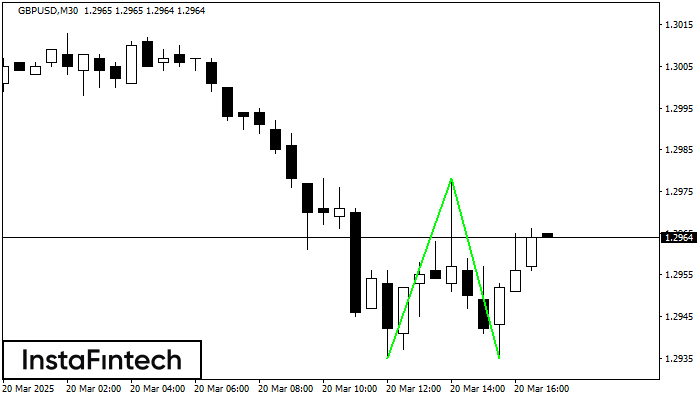
Corak Double Bottom telah dibentuk pada GBPUSD M30; sempadan atas adalah 1.2978; sempadan bawah adalah 1.2935. Lebar corak adalah 43 mata. Sekiranya penembusan sempadan atas 1.2978, perubahan aliran boleh diramalkan
Open chart in a new window
Segi Tiga Simetri Menurun
was formed on 20.03 at 15:31:02 (UTC+0)
signal strength 4 of 5
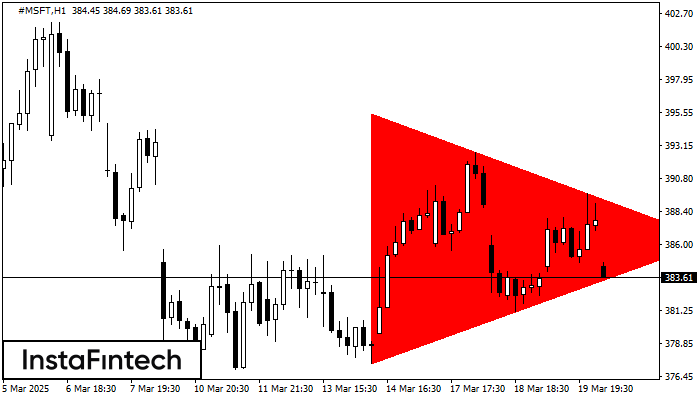
Berdasarkan carta H1, #MSFT membentuk corak Segi Tiga Simetri Menurun. Penerangan: Sempadan yang lebih rendah ialah 377.44/386.30 dan sempadan atas adalah 395.49/386.30. Lebar corak diukur pada carta pada -1805 pips
Open chart in a new window


