

Corak sebenar

Bullish Symmetrical Triangle
was formed on 18.03 at 20:46:23 (UTC+0)
signal strength 1 of 5
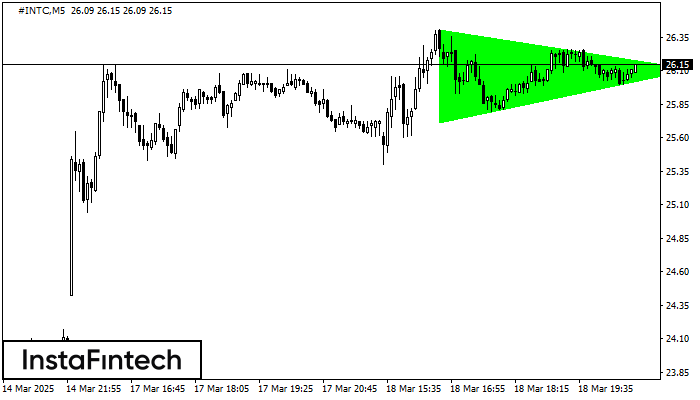
According to the chart of M5, #INTC formed the Bullish Symmetrical Triangle pattern. The lower border of the pattern touches the coordinates 25.72/26.11 whereas the upper border goes across 26.41/26.11. If the Bullish Symmetrical Triangle pattern is in progress, this evidently signals a further upward trend. In other words, in case the scenario comes true, the price of #INTC will breach the upper border to head for 26.26.
The M5 and M15 time frames may have more false entry points.
- All
- All
- Bearish Rectangle
- Bearish Symmetrical Triangle
- Bearish Symmetrical Triangle
- Bullish Rectangle
- Double Top
- Double Top
- Triple Bottom
- Triple Bottom
- Triple Top
- Triple Top
- All
- All
- Buy
- Sale
- All
- 1
- 2
- 3
- 4
- 5
Segi Empat Menaik
was formed on 21.03 at 00:40:12 (UTC+0)
signal strength 2 of 5
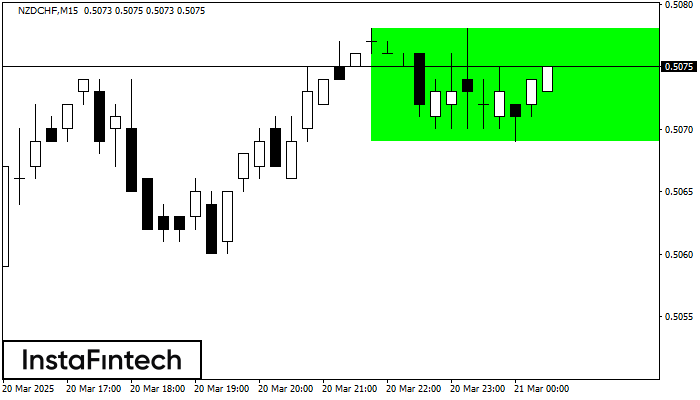
Berdasarkan carta M15, NZDCHF telah membentuk Segi Empat Menaik. Corak ini menunjukkan kesinambungan aliran. Sempadan atas adalah 0.5078, sempadan bawah adalah 0.5069. Isyarat bermakna bahawa kedudukan panjang perlu dibuka
Carta masa M5 dan M15 mungkin mempunyai lebih banyak titik kemasukan palsu.
Open chart in a new window
Segi Empat Menaik
was formed on 21.03 at 00:21:22 (UTC+0)
signal strength 1 of 5
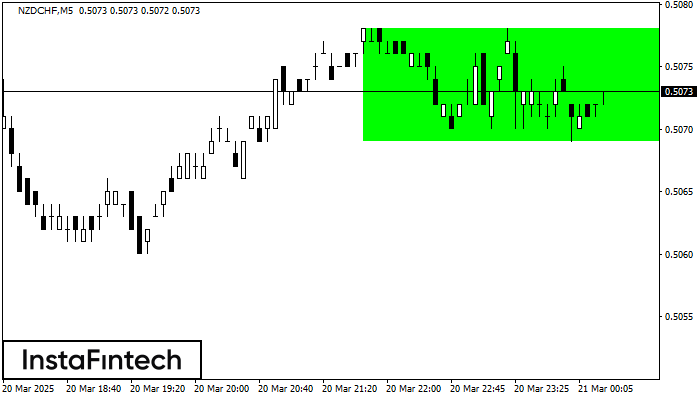
Berdasarkan carta M5, NZDCHF telah membentuk Segi Empat Menaik. Jenis corak ini menunjukkan kesinambungan aliran. Ia terdiri daripada dua tahap: rintangan 0.5078 dan sokongan 0.5069. Sekiranya tahap rintangan 0.5078
Carta masa M5 dan M15 mungkin mempunyai lebih banyak titik kemasukan palsu.
Open chart in a new window
Double Top
was formed on 21.03 at 00:00:09 (UTC+0)
signal strength 2 of 5
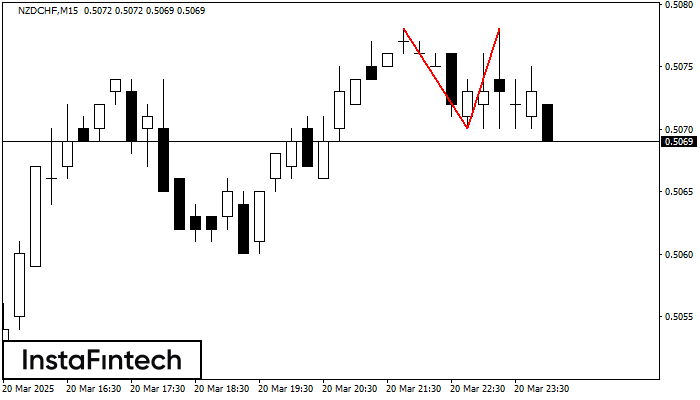
Corak Double Top telah dibentuk pada NZDCHF M15. Isyarat bahawa aliran telah berubah dari aliran menaik ke aliran menurun. Mungkin, sekiranya asas corak 0.5070 ditembusi, pergerakan menurun akan berterusan
Carta masa M5 dan M15 mungkin mempunyai lebih banyak titik kemasukan palsu.
Open chart in a new window


