

Corak sebenar

Triple Top
was formed on 18.03 at 12:30:10 (UTC+0)
signal strength 3 of 5
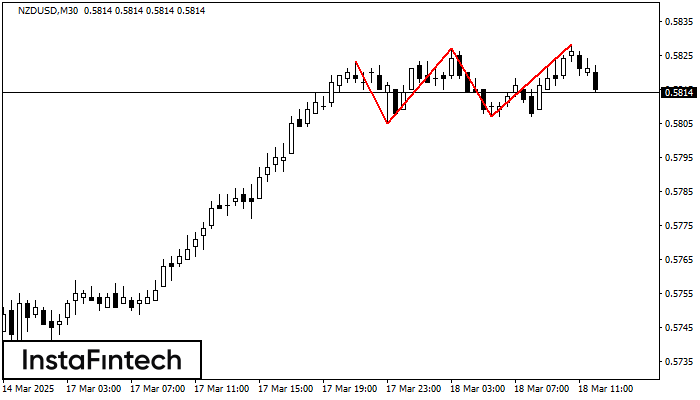
The Triple Top pattern has formed on the chart of the NZDUSD M30. Features of the pattern: borders have an ascending angle; the lower line of the pattern has the coordinates 0.5805/0.5807 with the upper limit 0.5823/0.5828; the projection of the width is 18 points. The formation of the Triple Top figure most likely indicates a change in the trend from upward to downward. This means that in the event of a breakdown of the support level of 0.5805, the price is most likely to continue the downward movement.
Juga lihat
- All
- All
- Bearish Rectangle
- Bearish Symmetrical Triangle
- Bearish Symmetrical Triangle
- Bullish Rectangle
- Double Top
- Double Top
- Triple Bottom
- Triple Bottom
- Triple Top
- Triple Top
- All
- All
- Buy
- Sale
- All
- 1
- 2
- 3
- 4
- 5
Double Top
was formed on 20.03 at 23:00:52 (UTC+0)
signal strength 1 of 5
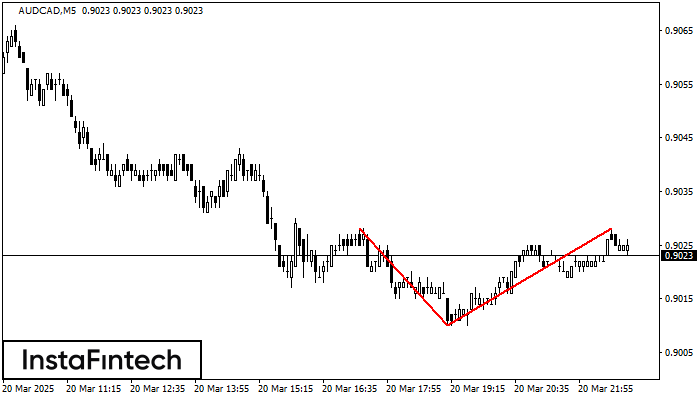
Corak pembalikan Double Top telah dibentuk pada AUDCAD M5. Ciri-ciri: sempadan atas %P0.000000; sempadan bawah 0.9028; sempadan bawah 0.9010; lebar corak adalah 18 mata. Dagangan menjual adalah lebih baik untuk
Carta masa M5 dan M15 mungkin mempunyai lebih banyak titik kemasukan palsu.
Open chart in a new window
Triple Top
was formed on 20.03 at 22:55:12 (UTC+0)
signal strength 1 of 5
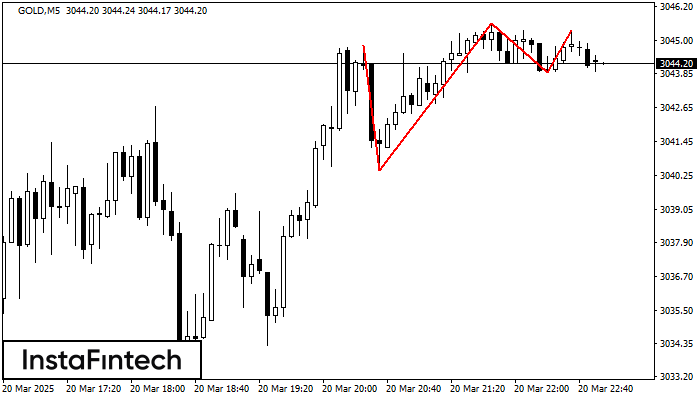
Corak Triple Top telah dibentuk pada carta bagi instrumen dagangan GOLD M5. Ia adalah corak pembalikan yang memaparkan ciri-ciri berikut: tahap rintangan -50, tahap sokongan -345, dan lebar corak
Carta masa M5 dan M15 mungkin mempunyai lebih banyak titik kemasukan palsu.
Open chart in a new window
Triple Top
was formed on 20.03 at 22:50:32 (UTC+0)
signal strength 1 of 5
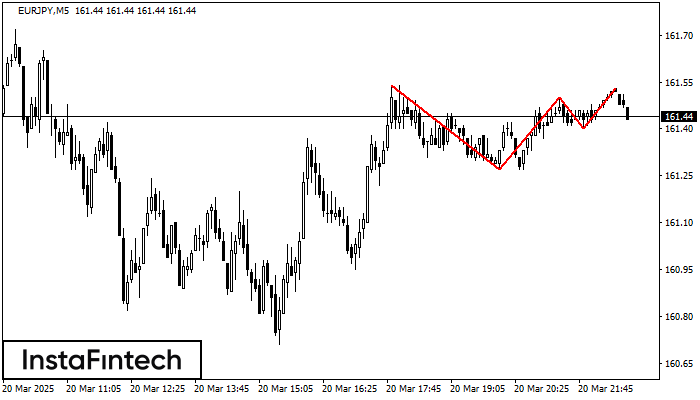
Pada carta instrumen dagangan EURJPY M5, corak Triple Top yang menandakan perubahan aliran telah terbentuk. Adalah mungkin bahawa selepas pembentukan bahagian atas ketiga, harga akan cuba menembusi tahap rintangan 161.27
Carta masa M5 dan M15 mungkin mempunyai lebih banyak titik kemasukan palsu.
Open chart in a new window


