

Corak sebenar

Double Top
was formed on 16.03 at 06:30:03 (UTC+0)
signal strength 1 of 5
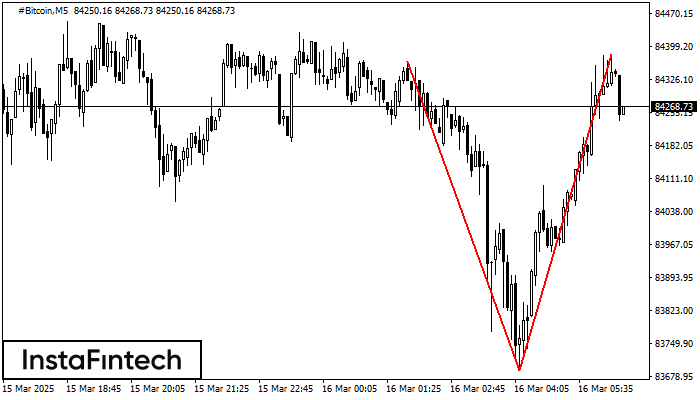
On the chart of #Bitcoin M5 the Double Top reversal pattern has been formed. Characteristics: the upper boundary 84382.33; the lower boundary 83691.55; the width of the pattern 69078 points. The signal: a break of the lower boundary will cause continuation of the downward trend targeting the 83691.40 level.
The M5 and M15 time frames may have more false entry points.
Juga lihat
- All
- All
- Bearish Rectangle
- Bearish Symmetrical Triangle
- Bearish Symmetrical Triangle
- Bullish Rectangle
- Double Top
- Double Top
- Triple Bottom
- Triple Bottom
- Triple Top
- Triple Top
- All
- All
- Buy
- Sale
- All
- 1
- 2
- 3
- 4
- 5
डबल टॉप
was formed on 17.03 at 08:00:35 (UTC+0)
signal strength 2 of 5
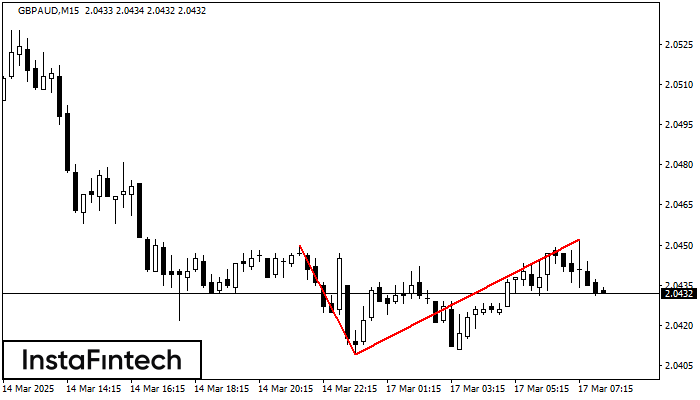
डबल टॉप पैटर्न GBPAUD M15 पर बना है। यह संकेत देता है कि प्रवृत्ति ऊपर से नीचे की ओर बदल गई है। संभवतः, यदि 2.0409 पैटर्न का आधार टूट जाता
M5 और M15 समय सीमा में अधिक फाल्स एंट्री पॉइंट्स हो सकते हैं।
Open chart in a new window
बुलिश आयत
was formed on 17.03 at 07:50:04 (UTC+0)
signal strength 1 of 5
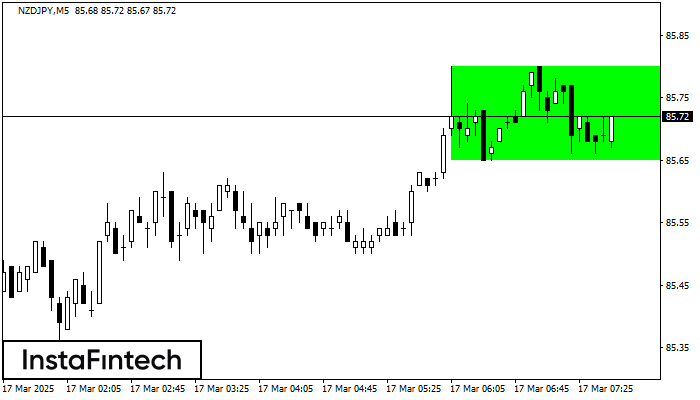
M5 के चार्ट के अनुसार, NZDJPY से बुलिश आयत बना। पैटर्न एक प्रवृत्ति निरंतरता को इंगित करता है। ऊपरी सीमा 85.80 है, निचली सीमा 85.65 है। सिग्नल का मतलब है
M5 और M15 समय सीमा में अधिक फाल्स एंट्री पॉइंट्स हो सकते हैं।
Open chart in a new window
डबल टॉप
was formed on 17.03 at 07:10:32 (UTC+0)
signal strength 1 of 5
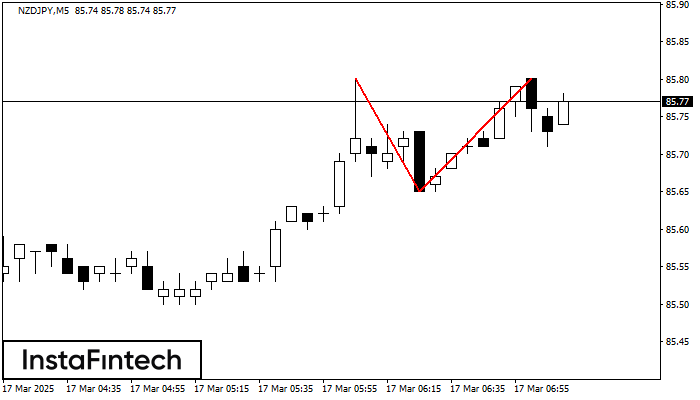
NZDJPY M5 पर डबल टॉप रीवर्सल पैटर्न बना है। विशेषताएं: ऊपरी सीमा 85.80; निचली सीमा 85.65; पैटर्न की चौड़ाई 15 पॉइंट्स है। सेल ट्रेडों को 85.65 की निचली सीमा के
M5 और M15 समय सीमा में अधिक फाल्स एंट्री पॉइंट्स हो सकते हैं।
Open chart in a new window


