

Corak sebenar

Double Top
was formed on 16.03 at 00:45:06 (UTC+0)
signal strength 2 of 5
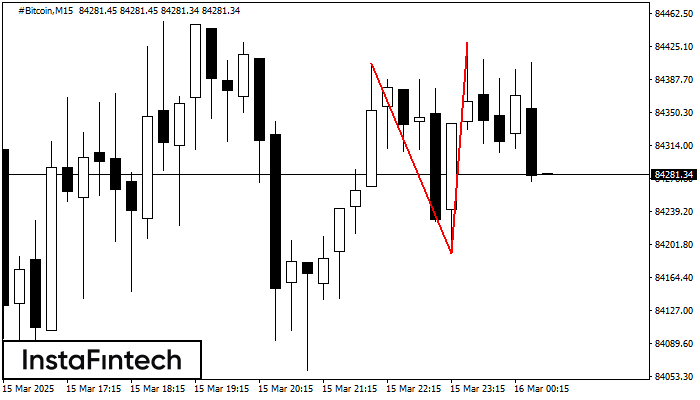
The Double Top reversal pattern has been formed on #Bitcoin M15. Characteristics: the upper boundary 84406.14; the lower boundary 84191.42; the width of the pattern is 23874 points. Sell trades are better to be opened below the lower boundary 84191.42 with a possible movements towards the 84191.20 level.
The M5 and M15 time frames may have more false entry points.
Juga lihat
- All
- All
- Bearish Rectangle
- Bearish Symmetrical Triangle
- Bearish Symmetrical Triangle
- Bullish Rectangle
- Double Top
- Double Top
- Triple Bottom
- Triple Bottom
- Triple Top
- Triple Top
- All
- All
- Buy
- Sale
- All
- 1
- 2
- 3
- 4
- 5
Double Top
was formed on 17.03 at 08:45:50 (UTC+0)
signal strength 1 of 5
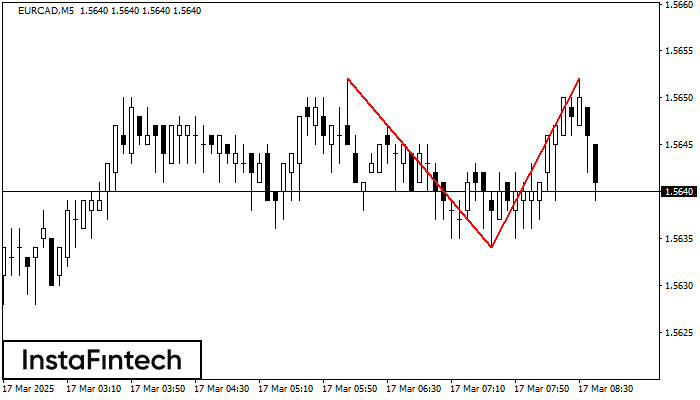
The Double Top pattern has been formed on EURCAD M5. It signals that the trend has been changed from upwards to downwards. Probably, if the base of the pattern 1.5634
The M5 and M15 time frames may have more false entry points.
Open chart in a new window
Double Top
was formed on 17.03 at 08:00:35 (UTC+0)
signal strength 2 of 5
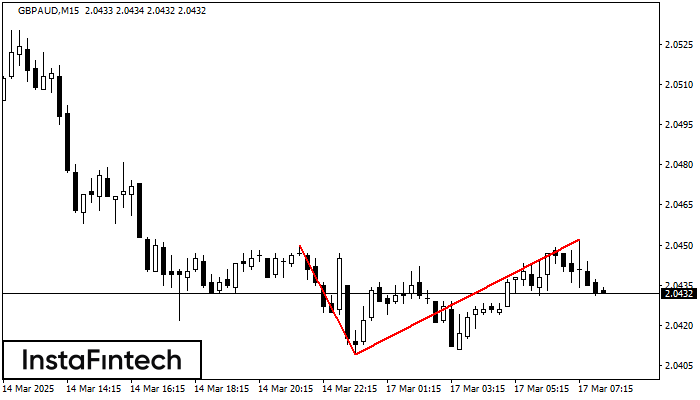
The Double Top pattern has been formed on GBPAUD M15. It signals that the trend has been changed from upwards to downwards. Probably, if the base of the pattern 2.0409
The M5 and M15 time frames may have more false entry points.
Open chart in a new window
Bullish Rectangle
was formed on 17.03 at 07:50:04 (UTC+0)
signal strength 1 of 5
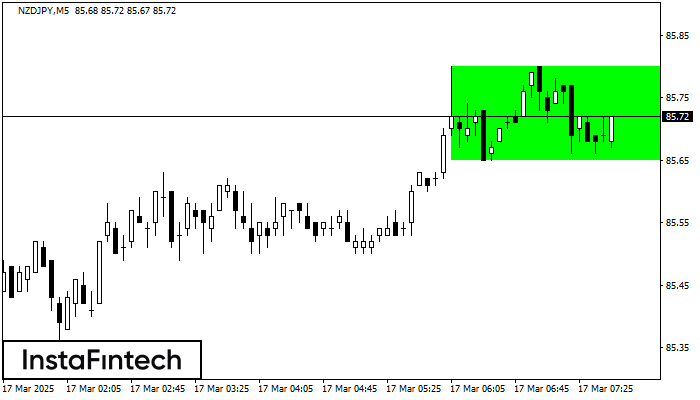
According to the chart of M5, NZDJPY formed the Bullish Rectangle. The pattern indicates a trend continuation. The upper border is 85.80, the lower border is 85.65. The signal means
The M5 and M15 time frames may have more false entry points.
Open chart in a new window


