Lihat juga


 31.03.2025 09:07 AM
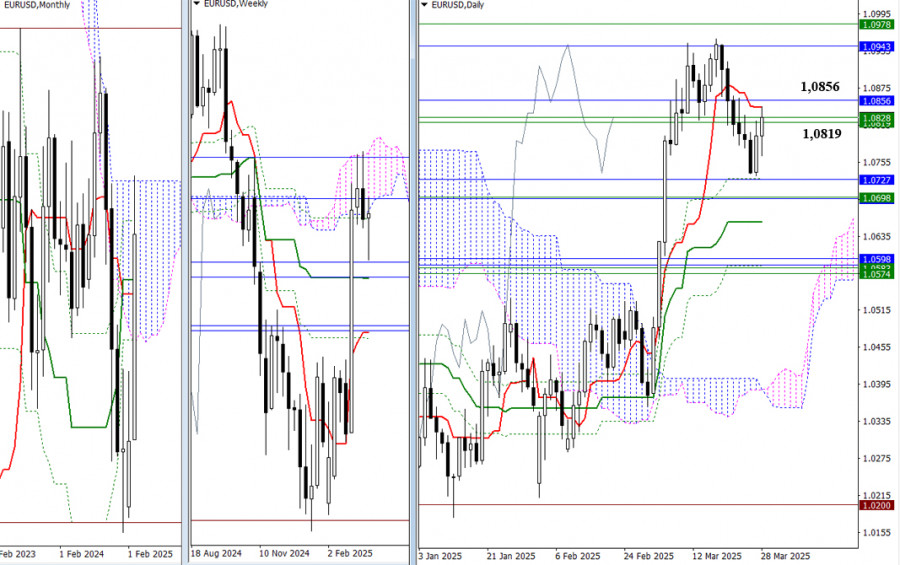
During the week, bearish players attempted to confirm the earlier-formed pullback and continue the decline but were unsuccessful, resulting in a long lower shadow on the weekly candlestick. The pair has returned to the cluster of resistance levels (1.0819–1.0856), which now represents the nearest resistance zone. Under the current conditions, a new phase of consolidation and uncertainty is possible. A firm consolidation above 1.0844–1.0856 would give buyers another opportunity to test the upper boundaries of the weekly (1.0978) and monthly (1.0943) Ichimoku clouds, aiming to break through and enter the bullish zone in terms of Ichimoku cloud analysis. If the current resistances are not broken and bearish players return to the market, the nearest downside targets in this part of the chart are around 1.0698–1.0727 and 1.0574–1.0598.
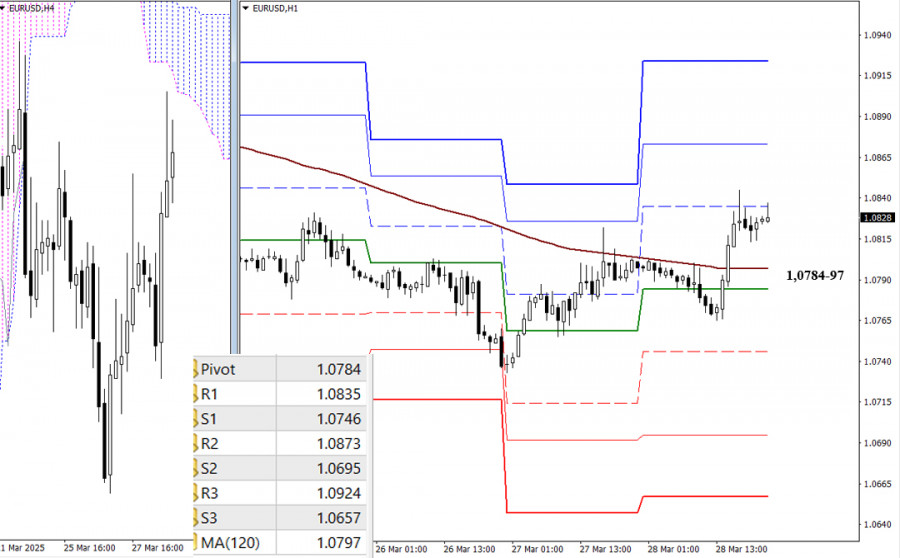
The main advantage currently lies with the bulls on the lower timeframes. If they reverse the weekly long-term trend (1.0797) and continue the upward movement, intraday reference points will be the resistances of the classic Pivot levels. Losing the key levels of 1.0784–1.0797 would affect the current balance of power, and increased bearish sentiment on the lower timeframes would develop through the breakdown of classic Pivot supports. Updated Pivot values will appear when the market opens.
***
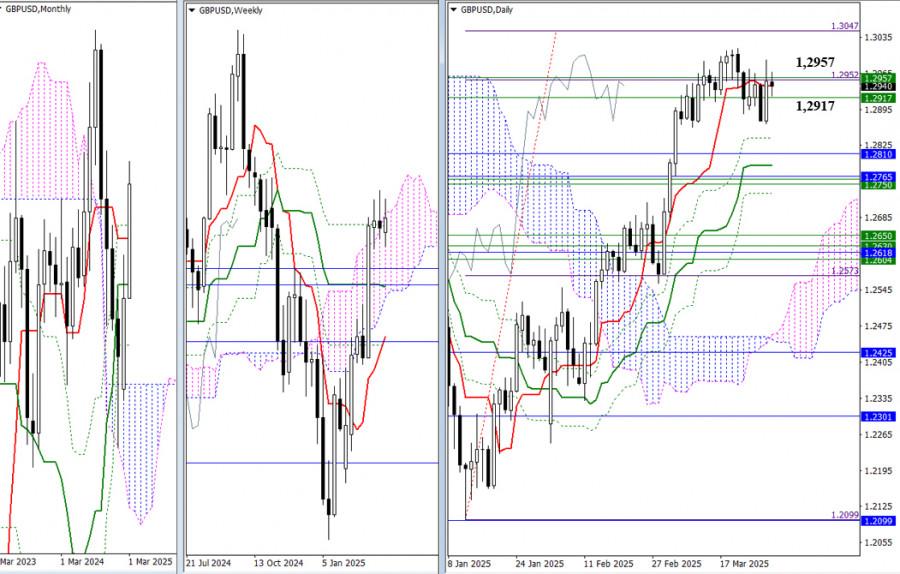
For the third consecutive week, the pound has been unable to exit the zone of uncertainty formed by the convergence of two weekly resistance levels (1.2917–1.2957) and the fulfillment of the daily target to break through the Ichimoku cloud at the first target level (1.2952). As a result, the situation has not significantly changed, and the following reference levels remain in place. For bulls, the nearest goal remains the daily target at 1.3047. Bears, meanwhile, still face a wide support zone that combines levels from multiple timeframes, headed by the monthly short-term trend (1.2765), the weekly medium-term trend (1.2761), and the daily medium-term trend (1.2786).
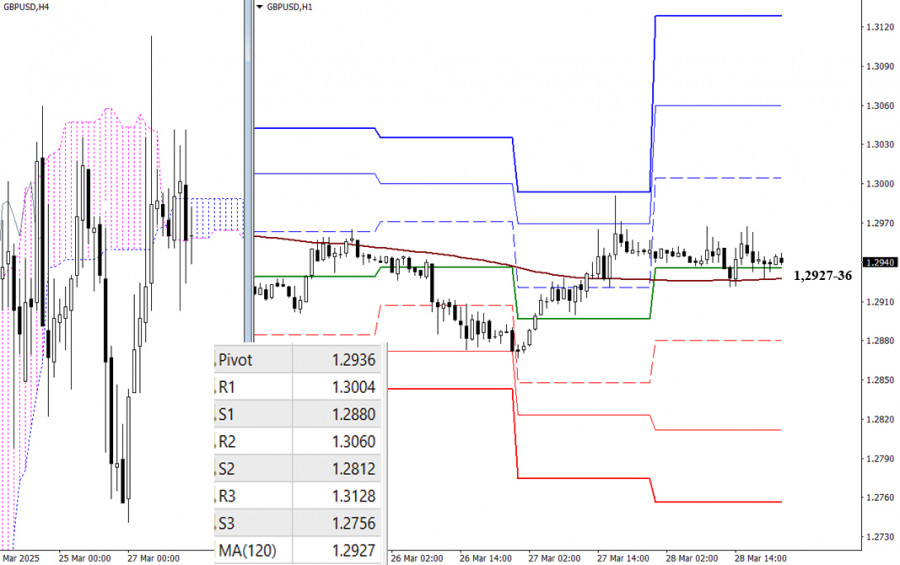
The uncertainty of the higher timeframes is also reflected in the lower timeframes. The pair has been hovering near the key levels of 1.2927–1.2936 (weekly long-term trend + daily central Pivot level) for an extended period. A restraining factor in this area is the influence of the H4 Ichimoku cloud, which is currently positioned almost horizontally. If a directional move forms, intraday reference points will be the support and resistance levels of the classic Pivot Points. New values for these Pivot levels will appear when the market opens.
***
You have already liked this post today
* Analisis pasaran yang disiarkan di sini adalah bertujuan untuk meningkatkan kesedaran anda, tetapi tidak untuk memberi arahan untuk membuat perdagangan.
Dari pemerhatian pada carta 4 jam, pasangan mata wang silang EUR/GBP kelihatan bergerak di atas EMA (100), yang menunjukkan bahawa Pembeli mendominasi pasangan mata wang ini. Oleh itu, dalam masa
Harga emas terus mendapat sokongan di tengah-tengah ketidakpastian yang menyelubungi hala tuju perang tarif yang dimulakan oleh Donald Trump. Harga emas telah meningkat hampir menegak selama empat bulan. Pendorong utama
Berdasarkan pemerhatian pada carta 4 jam indeks Nasdaq 100, terdapat beberapa perkara menarik, iaitu: pertama, pergerakan harga berada di bawah purata bergerak MA (100); kedua, kemunculan corak Segi Tiga (Triangle);
Penunjuk eagle sedang mencapai tahap terlebih beli yang ekstrem. Oleh itu, pada paras harga semasa yang berada di bawah paras tertinggi sepanjang masa, adalah mungkin untuk menjual dengan sasaran pada
Pada carta 4 jam, pasangan mata wang komoditi USD/CAD dapat dilihat bergerak di bawah EMA (100) dan kemunculan corak Bearish 123 serta kedudukan penunjuk Pengayun Stochastic yang sudah berada
Dengan keadaan Penunjuk Pengayun Stochastic menghampiri paras Terlebih Jual (20) pada carta 4 jam pasangan mata wang silang AUD/JPY, dalam masa terdekat AUD/JPY berpotensi untuk melemah ke kawasan paras 89.75–89.39
Kelab InstaTrade

Your IP address shows that you are currently located in the USA. If you are a resident of the United States, you are prohibited from using the services of InstaFintech Group including online trading, online transfers, deposit/withdrawal of funds, etc.
If you think you are seeing this message by mistake and your location is not the US, kindly proceed to the website. Otherwise, you must leave the website in order to comply with government restrictions.
Why does your IP address show your location as the USA?
Please confirm whether you are a US resident or not by clicking the relevant button below. If you choose the wrong option, being a US resident, you will not be able to open an account with InstaTrade anyway.
We are sorry for any inconvenience caused by this message.


