Lihat juga


 12.03.2025 10:46 AM
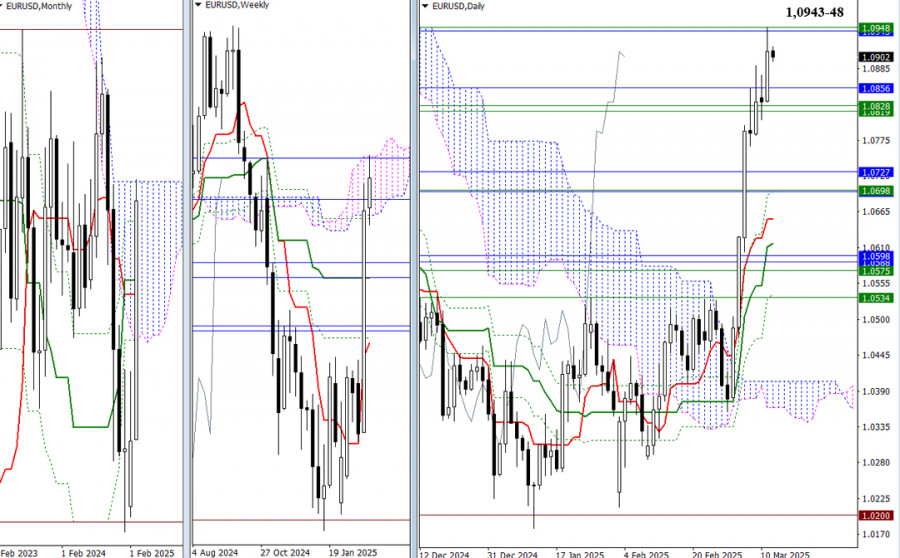
The bulls have successfully broken out of the gravitational zone between 1.0819 and 1.0856, continuing their upward movement to reach the key levels of 1.0943 to 1.0948. Currently, as the pair tests the upper boundaries of the weekly and monthly Ichimoku cloud, a breakout could lead to consolidation in the bullish zone, allowing for higher targets for further gains. However, if the bulls fail to achieve this, the pair may revert to the cluster of levels around 1.0819 to 1.0856.
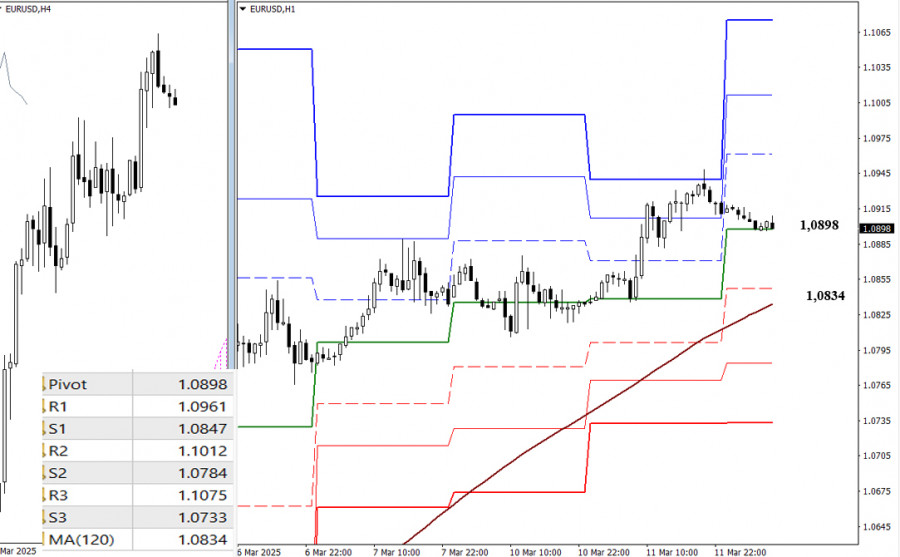
On lower timeframes, the pair is in a corrective zone, testing support at the central Pivot level of the day, which is 1.0898. A break below this level would open the path toward the weekly long-term trend at 1.0834. Should this level be breached and the trend reverse, it could shift the current balance of power. Additional reference points to monitor for further declines include the classic Pivot levels at 1.0784 and 1.0733. If the corrective pullback ends and the bulls regain control, attention will shift back to the resistance of the classic Pivot levels at 1.0961, 1.1012, and 1.1075, which are key bullish targets for the day.
***
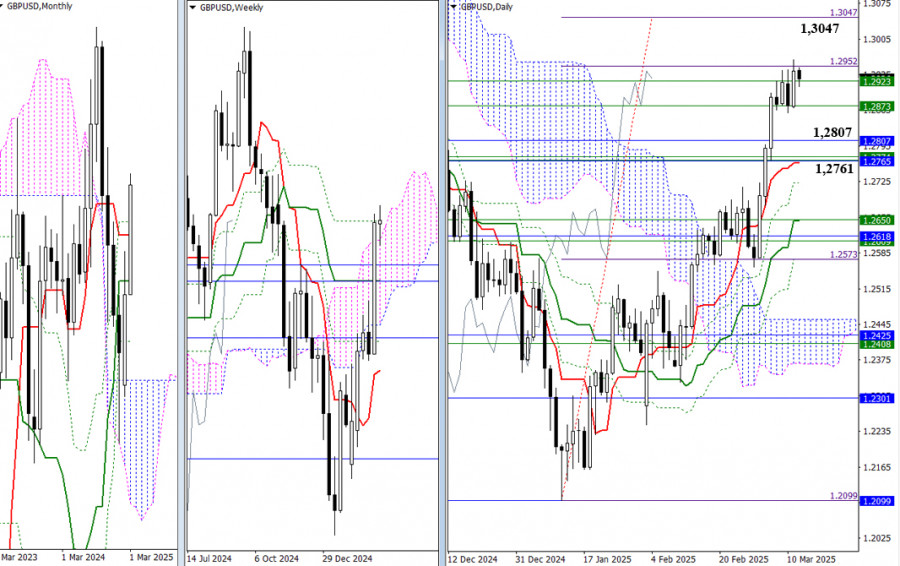
The currency pair is currently testing weekly resistance levels between 1.2873 and 1.2923, along with the first target level for a breakout from the daily Ichimoku cloud at 1.2952. A phase of consolidation and uncertainty is emerging. If the bulls succeed in breaking out of this consolidation zone, their next target will be to reach the 100% breakout level of 1.3047. Conversely, if the bears gain control and push the pair lower, they will first encounter previously tested higher timeframe support levels at 1.2807 and 1.2765, which are reinforced by the daily short-term trend at 1.2761.
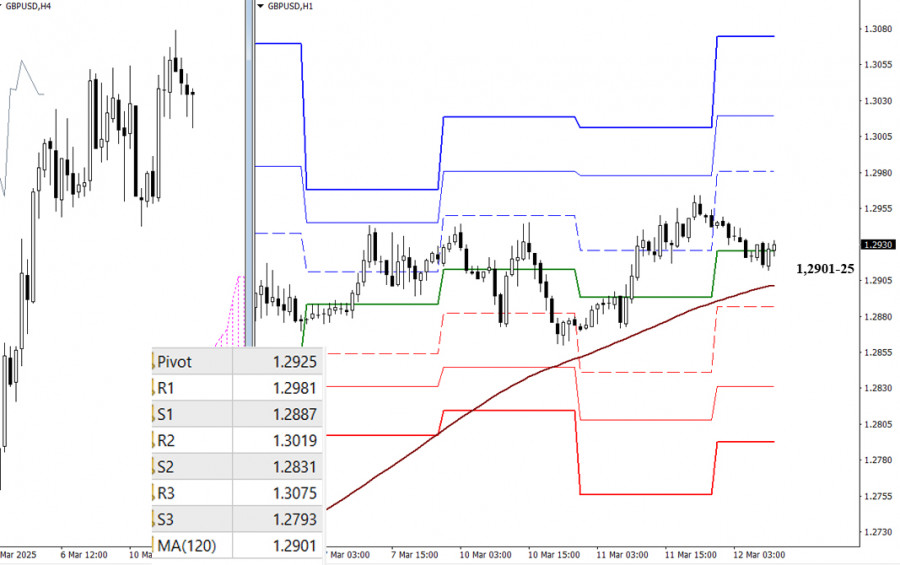
On lower timeframes, during the ongoing corrective decline, the pair is testing key levels at 1.2925 (the central pivot level for the day) and 1.2901 (the weekly long-term trend). A breakout and trend reversal at these levels would give an advantage to the bears. For further downward movement, the pair needs to break through the support of the classic Pivot levels at 1.2887, 1.2831, and 1.2793. If the correction concludes, attention will turn to resistance of the classic Pivot levels at 1.2981, 1.3019, and 1.3075.
***
You have already liked this post today
* Analisis pasaran yang disiarkan di sini adalah bertujuan untuk meningkatkan kesedaran anda, tetapi tidak untuk memberi arahan untuk membuat perdagangan.
Dari pemerhatian pada carta 4 jam, pasangan mata wang silang EUR/GBP kelihatan bergerak di atas EMA (100), yang menunjukkan bahawa Pembeli mendominasi pasangan mata wang ini. Oleh itu, dalam masa
Dengan kemunculan Penumpuan (Convergence) antara pergerakan harga pasangan mata wang utama USD/JPY dengan penunjuk Pengayun Stochastic serta kedudukan EMA (100) yang berada di atas harga semasa, dalam masa terdekat USD/JPY
Harga emas terus mendapat sokongan di tengah-tengah ketidakpastian yang menyelubungi hala tuju perang tarif yang dimulakan oleh Donald Trump. Harga emas telah meningkat hampir menegak selama empat bulan. Pendorong utama
Berdasarkan pemerhatian pada carta 4 jam indeks Nasdaq 100, terdapat beberapa perkara menarik, iaitu: pertama, pergerakan harga berada di bawah purata bergerak MA (100); kedua, kemunculan corak Segi Tiga (Triangle);
Penunjuk eagle sedang mencapai tahap terlebih beli yang ekstrem. Oleh itu, pada paras harga semasa yang berada di bawah paras tertinggi sepanjang masa, adalah mungkin untuk menjual dengan sasaran pada
Pada carta 4 jam, pasangan mata wang komoditi USD/CAD dapat dilihat bergerak di bawah EMA (100) dan kemunculan corak Bearish 123 serta kedudukan penunjuk Pengayun Stochastic yang sudah berada
Dengan keadaan Penunjuk Pengayun Stochastic menghampiri paras Terlebih Jual (20) pada carta 4 jam pasangan mata wang silang AUD/JPY, dalam masa terdekat AUD/JPY berpotensi untuk melemah ke kawasan paras 89.75–89.39
Carta Forex
Versi-Web

Your IP address shows that you are currently located in the USA. If you are a resident of the United States, you are prohibited from using the services of InstaFintech Group including online trading, online transfers, deposit/withdrawal of funds, etc.
If you think you are seeing this message by mistake and your location is not the US, kindly proceed to the website. Otherwise, you must leave the website in order to comply with government restrictions.
Why does your IP address show your location as the USA?
Please confirm whether you are a US resident or not by clicking the relevant button below. If you choose the wrong option, being a US resident, you will not be able to open an account with InstaTrade anyway.
We are sorry for any inconvenience caused by this message.


