

Өзекті паттерндер

Двойное дно
сформирован 31.03 в 09:45:35 (UTC+0)
сила сигнала 2 из 5
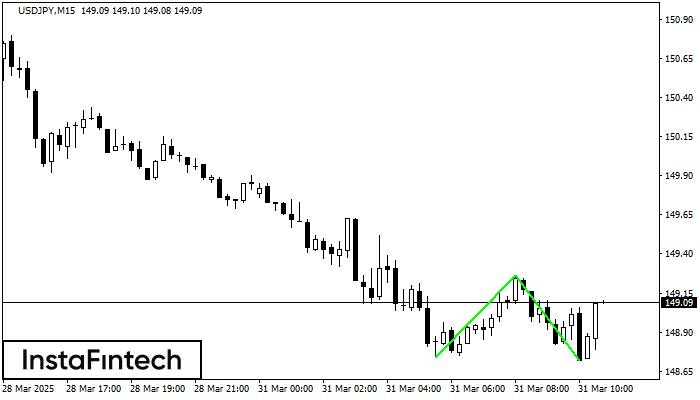
Сформирована фигура «Двойное дно» на графике USDJPY M15. Характеристика: Уровень поддержки 148.74; Уровень сопротивления 149.26; Ширина фигуры 52 пунктов. В случае пробоя уровня сопротивления можно будет прогнозировать изменение тенденции, где первая точка фиксации прибыли находится на расстоянии 54 пунктов.
Таймфреймы М5 и М15 могут иметь больше ложных точек входа.
Сондай-ақ қараңыз
- Все
- Все
- Bearish Rectangle
- Bearish Symmetrical Triangle
- Bearish Symmetrical Triangle
- Bullish Rectangle
- Double Top
- Double Top
- Triple Bottom
- Triple Bottom
- Triple Top
- Triple Top
- Все
- Все
- Покупка
- Продажа
- Все
- 1
- 2
- 3
- 4
- 5
Double Bottom
was formed on 11.04 at 07:30:10 (UTC+0)
signal strength 2 of 5
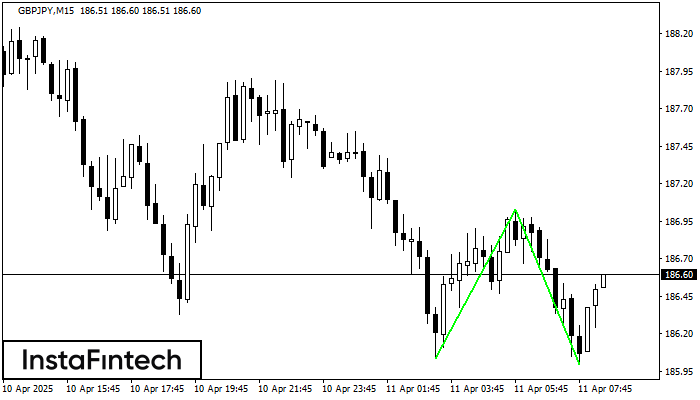
The Double Bottom pattern has been formed on GBPJPY M15; the upper boundary is 187.03; the lower boundary is 186.00. The width of the pattern is 99 points. In case
The M5 and M15 time frames may have more false entry points.
Open chart in a new window
Double Bottom
was formed on 11.04 at 07:30:02 (UTC+0)
signal strength 2 of 5
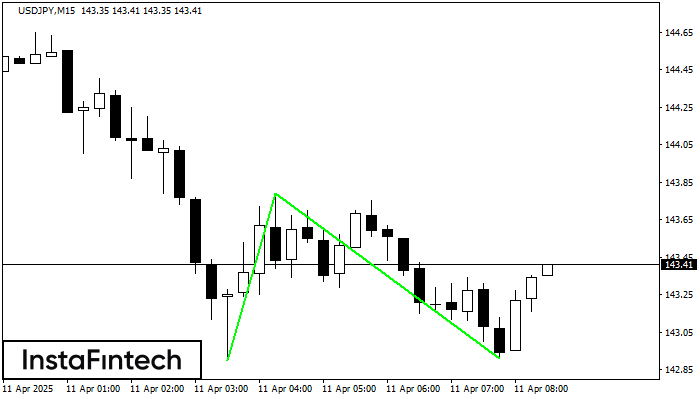
The Double Bottom pattern has been formed on USDJPY M15; the upper boundary is 143.79; the lower boundary is 142.91. The width of the pattern is 89 points. In case
The M5 and M15 time frames may have more false entry points.
Open chart in a new window
Bullish Rectangle
was formed on 11.04 at 07:14:49 (UTC+0)
signal strength 1 of 5
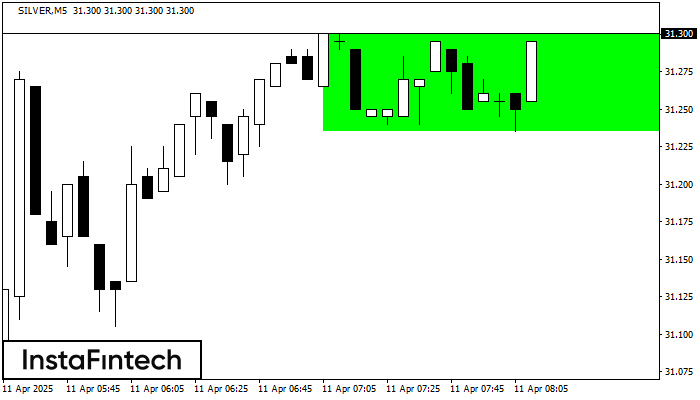
According to the chart of M5, SILVER formed the Bullish Rectangle. The pattern indicates a trend continuation. The upper border is 31.30, the lower border is 31.23. The signal means
The M5 and M15 time frames may have more false entry points.
Open chart in a new window


