

Өзекті паттерндер

Медвежий вымпел
сформирован 27.03 в 16:26:41 (UTC+0)
сила сигнала 1 из 5
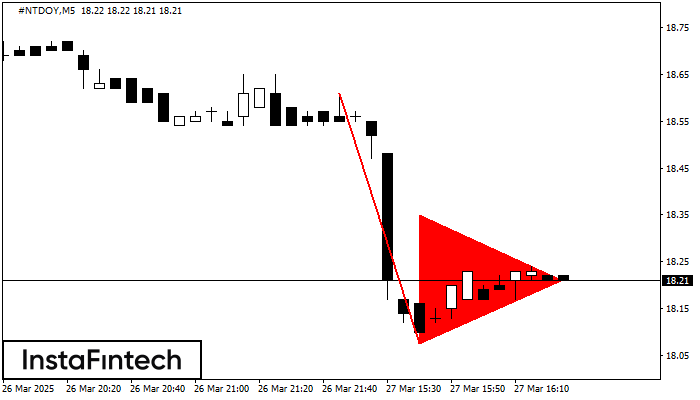
На графике #NTDOY M5 сформировалась фигура «Медвежий вымпел», которая сигнализирует о возможном продолжении тренда. Характеристика: основание фигуры имеет координаты 18.08; проекция высоты флагштока равна 53 пунктов. В случае если цена преодолеет основание фигуры 18.08, то ожидается продолжение нисходящего тренда на уровень 17.93 пунктов.
Таймфреймы М5 и М15 могут иметь больше ложных точек входа.
Сондай-ақ қараңыз
- Все
- Все
- Bearish Rectangle
- Bearish Symmetrical Triangle
- Bearish Symmetrical Triangle
- Bullish Rectangle
- Double Top
- Double Top
- Triple Bottom
- Triple Bottom
- Triple Top
- Triple Top
- Все
- Все
- Покупка
- Продажа
- Все
- 1
- 2
- 3
- 4
- 5
Bearish pennant
was formed on 30.03 at 23:26:32 (UTC+0)
signal strength 1 of 5

The Bearish pennant pattern has formed on the AUDCHF M5 chart. The pattern signals continuation of the downtrend in case the pennant’s low of 0.5526 is broken through. Recommendations: Place
The M5 and M15 time frames may have more false entry points.
Open chart in a new window
Double Top
was formed on 30.03 at 23:15:27 (UTC+0)
signal strength 2 of 5
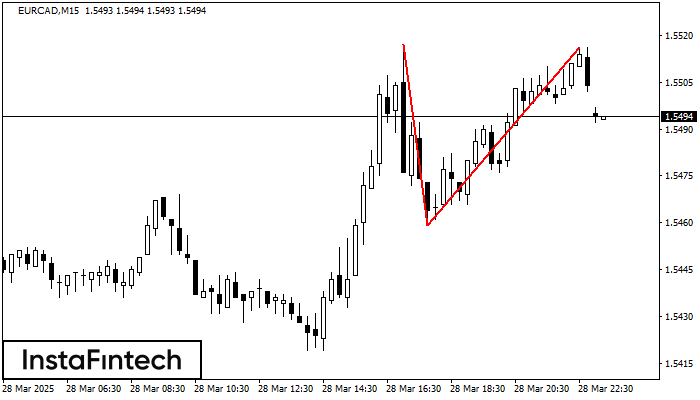
The Double Top pattern has been formed on EURCAD M15. It signals that the trend has been changed from upwards to downwards. Probably, if the base of the pattern 1.5459
The M5 and M15 time frames may have more false entry points.
Open chart in a new window
Double Bottom
was formed on 30.03 at 23:00:32 (UTC+0)
signal strength 2 of 5
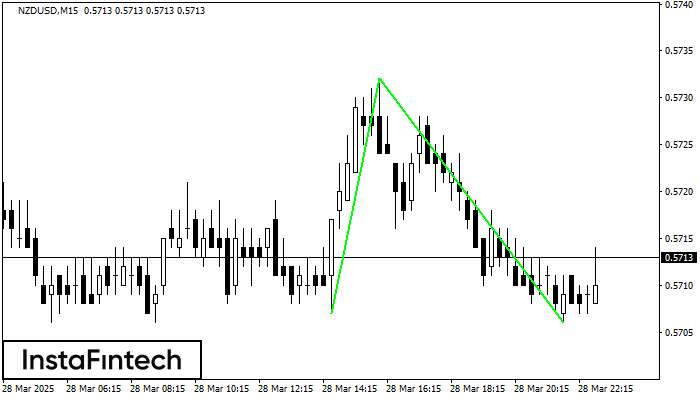
The Double Bottom pattern has been formed on NZDUSD M15; the upper boundary is 0.5732; the lower boundary is 0.5706. The width of the pattern is 25 points. In case
The M5 and M15 time frames may have more false entry points.
Open chart in a new window


