

Өзекті паттерндер

Двойное дно
сформирован 21.03 в 03:15:20 (UTC+0)
сила сигнала 1 из 5
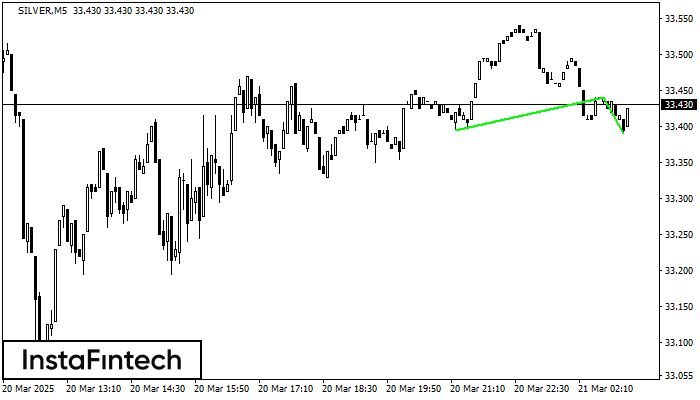
Сформирована фигура «Двойное дно» на графике SILVER M5. Данное формирование сигнализирует об изменении тенденции с нисходящего на восходящее движение. Сигнал: Торговую позицию на покупку следует открывать после пробоя верхней границы фигуры 33.44, где перспектива будущего хода будет являться шириной текущей фигуры - 45 пунктов.
Таймфреймы М5 и М15 могут иметь больше ложных точек входа.
Сондай-ақ қараңыз
- Все
- Все
- Bearish Rectangle
- Bearish Symmetrical Triangle
- Bearish Symmetrical Triangle
- Bullish Rectangle
- Double Top
- Double Top
- Triple Bottom
- Triple Bottom
- Triple Top
- Triple Top
- Все
- Все
- Покупка
- Продажа
- Все
- 1
- 2
- 3
- 4
- 5
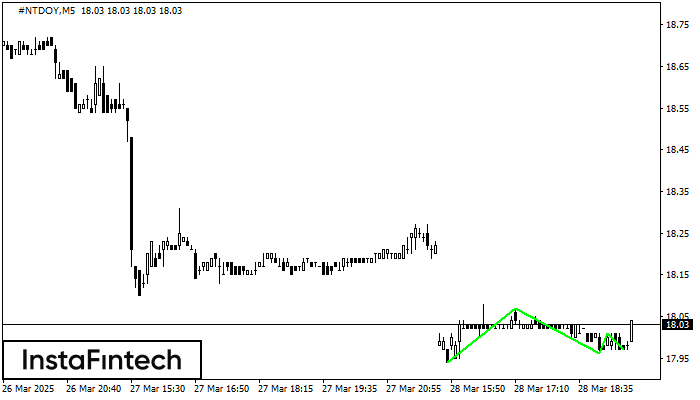
Triple Bottom
was formed on 28.03 at 19:46:37 (UTC+0)
signal strength 1 of 5

The Triple Bottom pattern has formed on the chart of the #NTDOY M5 trading instrument. The pattern signals a change in the trend from downwards to upwards in the case
The M5 and M15 time frames may have more false entry points.
Open chart in a new window
Triple Bottom
was formed on 28.03 at 19:46:29 (UTC+0)
signal strength 1 of 5
The Triple Bottom pattern has formed on the chart of the #NTDOY M5 trading instrument. The pattern signals a change in the trend from downwards to upwards in the case
The M5 and M15 time frames may have more false entry points.
Open chart in a new window
Bearish Symmetrical Triangle
was formed on 28.03 at 19:23:04 (UTC+0)
signal strength 4 of 5
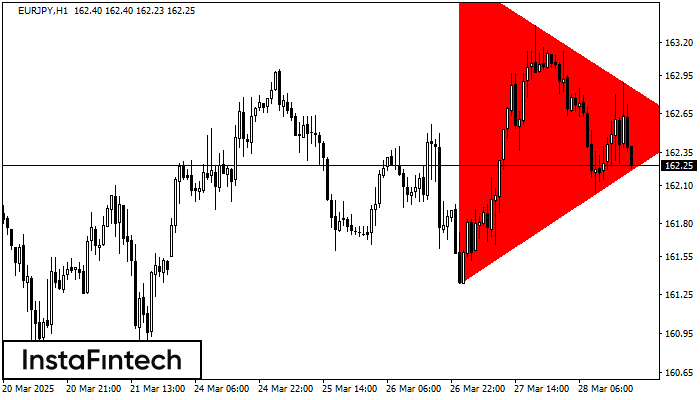
According to the chart of H1, EURJPY formed the Bearish Symmetrical Triangle pattern. This pattern signals a further downward trend in case the lower border 161.34 is breached. Here
Open chart in a new window


