Өзекті паттерндер

Прямоугольник
сформирован 20.03 в 15:04:01 (UTC+0)
сила сигнала 1 из 5
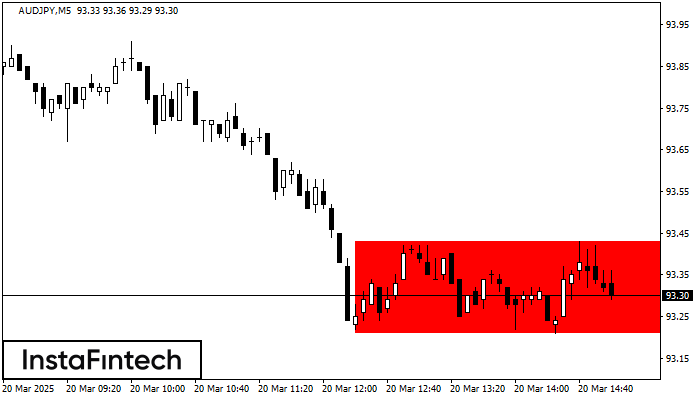
Сформирована фигура «Прямоугольник» на графике AUDJPY M5. Тип фигуры: Продолжение тренда; Границы: Верхняя 93.43, Нижняя 93.21; Сигнал: позиция на продажу открывается после фиксации цены ниже границы прямоугольника 93.21.
Таймфреймы М5 и М15 могут иметь больше ложных точек входа.
- Все
- Все
- Bearish Rectangle
- Bearish Symmetrical Triangle
- Bearish Symmetrical Triangle
- Bullish Rectangle
- Double Top
- Double Top
- Triple Bottom
- Triple Bottom
- Triple Top
- Triple Top
- Все
- Все
- Покупка
- Продажа
- Все
- 1
- 2
- 3
- 4
- 5
Double Top
сформирован 21.03 в 20:10:26 (UTC+0)
сила сигнала 1 из 5
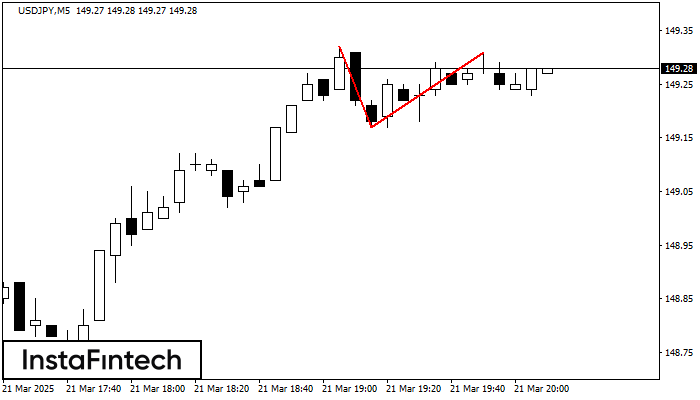
On the chart of USDJPY M5 the Double Top reversal pattern has been formed. Characteristics: the upper boundary 149.31; the lower boundary 149.17; the width of the pattern 14 points
The M5 and M15 time frames may have more false entry points.
Открыть график инструмента в новом окне
Double Top
сформирован 21.03 в 20:00:35 (UTC+0)
сила сигнала 1 из 5
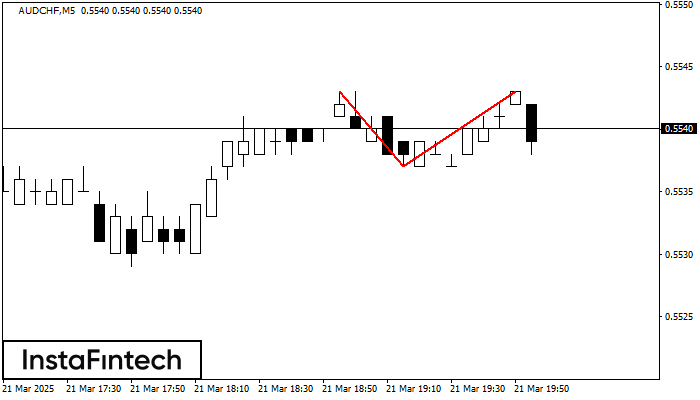
The Double Top reversal pattern has been formed on AUDCHF M5. Characteristics: the upper boundary 0.5543; the lower boundary 0.5537; the width of the pattern is 6 points. Sell trades
The M5 and M15 time frames may have more false entry points.
Открыть график инструмента в новом окне
Inverse Head and Shoulder
сформирован 21.03 в 19:50:04 (UTC+0)
сила сигнала 1 из 5
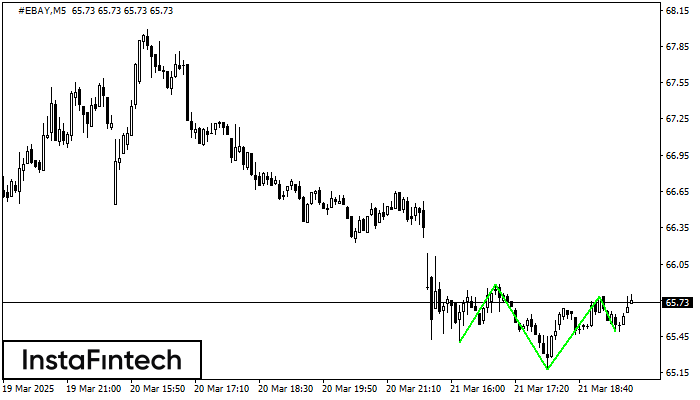
According to the chart of M5, #EBAY formed the Inverse Head and Shoulder pattern. The Head’s top is set at 65.78 while the median line of the Neck is found
The M5 and M15 time frames may have more false entry points.
Открыть график инструмента в новом окне