

Өзекті паттерндер

Медвежий вымпел
сформирован 20.03 в 07:10:03 (UTC+0)
сила сигнала 4 из 5
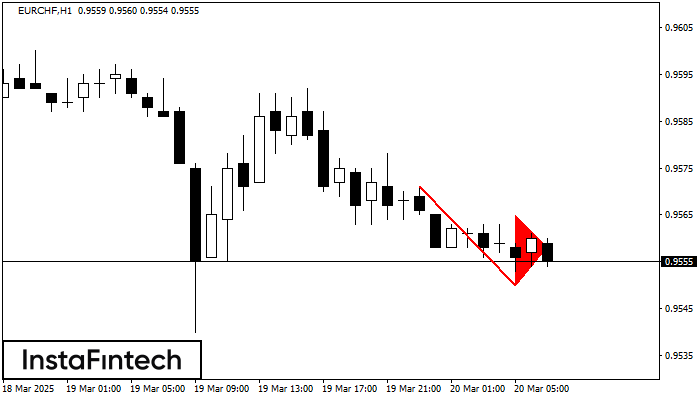
На графике EURCHF H1 сформировалась фигура «Медвежий вымпел», которая сигнализирует о возможном продолжении тренда. Характеристика: основание фигуры имеет координаты 0.9550; проекция высоты флагштока равна 21 пунктов. В случае если цена преодолеет основание фигуры 0.9550, то ожидается продолжение нисходящего тренда на уровень 0.9510 пунктов.
Сондай-ақ қараңыз
- Все
- Все
- Bearish Rectangle
- Bearish Symmetrical Triangle
- Bearish Symmetrical Triangle
- Bullish Rectangle
- Double Top
- Double Top
- Triple Bottom
- Triple Bottom
- Triple Top
- Triple Top
- Все
- Все
- Покупка
- Продажа
- Все
- 1
- 2
- 3
- 4
- 5
Double Bottom
сформирован 22.03 в 17:34:47 (UTC+0)
сила сигнала 1 из 5

The Double Bottom pattern has been formed on #Bitcoin M5. Characteristics: the support level 83931.70; the resistance level 84051.13; the width of the pattern 11943 points. If the resistance level
The M5 and M15 time frames may have more false entry points.
Открыть график инструмента в новом окне
Bullish Symmetrical Triangle
сформирован 21.03 в 22:40:31 (UTC+0)
сила сигнала 1 из 5

According to the chart of M5, AUDUSD formed the Bullish Symmetrical Triangle pattern. Description: This is the pattern of a trend continuation. 0.6279 and 0.6267 are the coordinates
The M5 and M15 time frames may have more false entry points.
Открыть график инструмента в новом окне
Bullish Symmetrical Triangle
сформирован 21.03 в 22:36:29 (UTC+0)
сила сигнала 1 из 5

According to the chart of M5, USDCHF formed the Bullish Symmetrical Triangle pattern. The lower border of the pattern touches the coordinates 0.8825/0.8830 whereas the upper border goes across 0.8835/0.8830
The M5 and M15 time frames may have more false entry points.
Открыть график инструмента в новом окне


