

Өзекті паттерндер

Бычий флаг
сформирован 19.03 в 22:51:00 (UTC+0)
сила сигнала 1 из 5
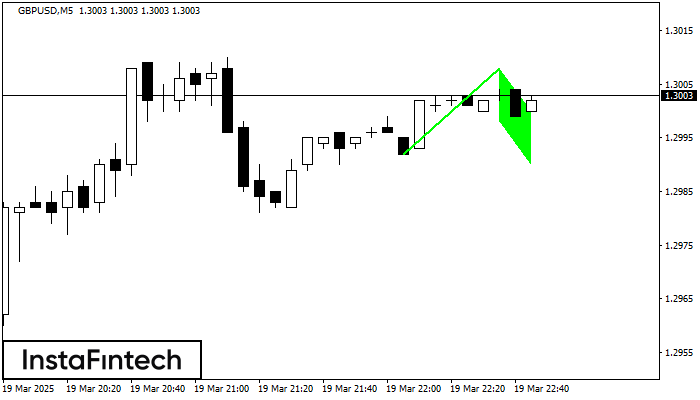
На графике GBPUSD M5 сформировалась фигура продолжения тренда «Бычий флаг». Прогноз: Фиксация цены выше максимума фигуры 1.3008 предоставит трейдеру возможность открыть длинную позицию на покупку до уровня 1.3023.
Таймфреймы М5 и М15 могут иметь больше ложных точек входа.
- Все
- Все
- Bearish Rectangle
- Bearish Symmetrical Triangle
- Bearish Symmetrical Triangle
- Bullish Rectangle
- Double Top
- Double Top
- Triple Bottom
- Triple Bottom
- Triple Top
- Triple Top
- Все
- Все
- Покупка
- Продажа
- Все
- 1
- 2
- 3
- 4
- 5
Triple Bottom
сформирован 20.03 в 14:50:12 (UTC+0)
сила сигнала 1 из 5
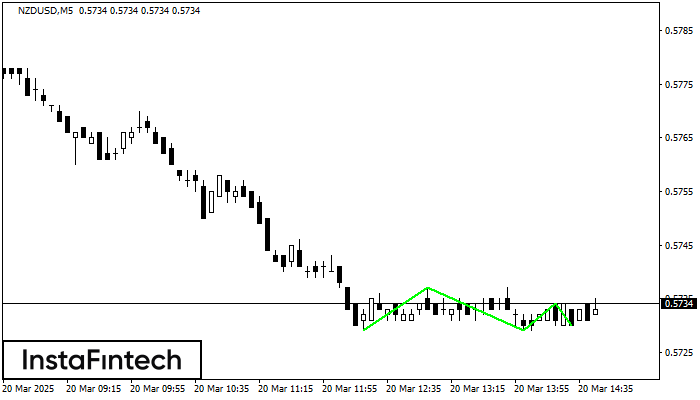
The Triple Bottom pattern has formed on the chart of the NZDUSD M5 trading instrument. The pattern signals a change in the trend from downwards to upwards in the case
The M5 and M15 time frames may have more false entry points.
Открыть график инструмента в новом окне
Double Bottom
сформирован 20.03 в 14:49:48 (UTC+0)
сила сигнала 1 из 5
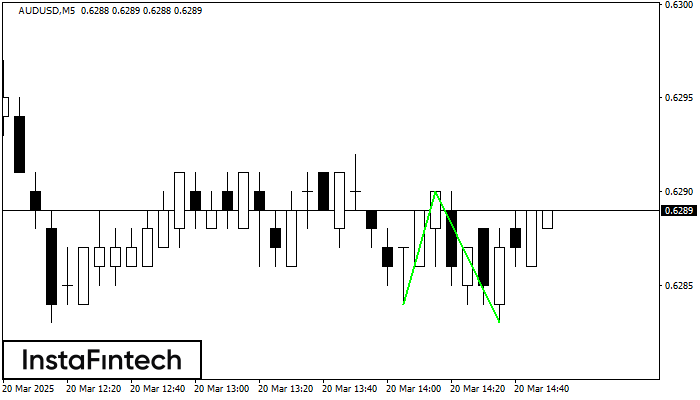
The Double Bottom pattern has been formed on AUDUSD M5. Characteristics: the support level 0.6284; the resistance level 0.6290; the width of the pattern 6 points. If the resistance level
The M5 and M15 time frames may have more false entry points.
Открыть график инструмента в новом окне
Double Bottom
сформирован 20.03 в 14:34:58 (UTC+0)
сила сигнала 1 из 5
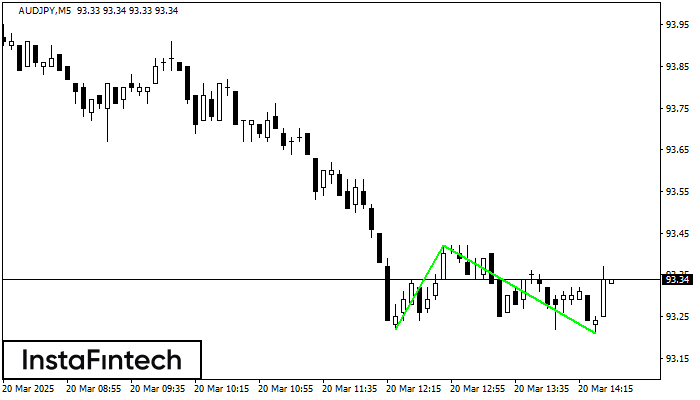
The Double Bottom pattern has been formed on AUDJPY M5; the upper boundary is 93.42; the lower boundary is 93.21. The width of the pattern is 20 points. In case
The M5 and M15 time frames may have more false entry points.
Открыть график инструмента в новом окне


