Өзекті паттерндер

Двойное дно
сформирован 19.03 в 22:35:27 (UTC+0)
сила сигнала 1 из 5
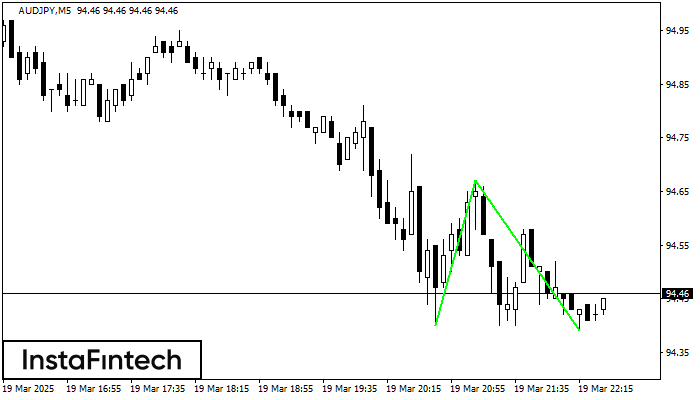
Сформирована фигура «Двойное дно» на графике AUDJPY M5. Характеристика: Уровень поддержки 94.40; Уровень сопротивления 94.67; Ширина фигуры 27 пунктов. В случае пробоя уровня сопротивления можно будет прогнозировать изменение тенденции, где первая точка фиксации прибыли находится на расстоянии 28 пунктов.
Таймфреймы М5 и М15 могут иметь больше ложных точек входа.
- Все
- Все
- Bearish Rectangle
- Bearish Symmetrical Triangle
- Bearish Symmetrical Triangle
- Bullish Rectangle
- Double Top
- Double Top
- Triple Bottom
- Triple Bottom
- Triple Top
- Triple Top
- Все
- Все
- Покупка
- Продажа
- Все
- 1
- 2
- 3
- 4
- 5
Triple Bottom
сформирован 20.03 в 13:39:49 (UTC+0)
сила сигнала 1 из 5
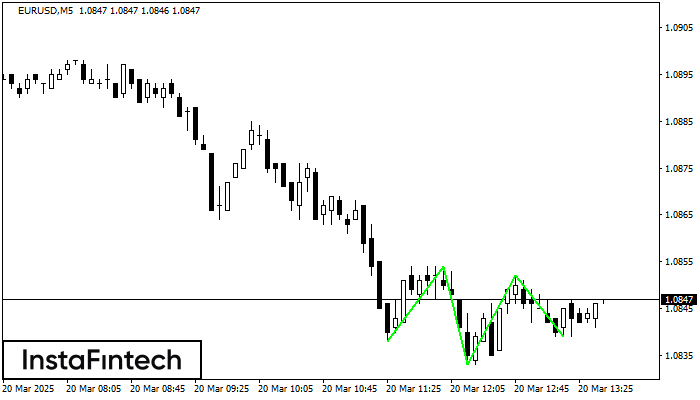
The Triple Bottom pattern has formed on the chart of EURUSD M5. Features of the pattern: The lower line of the pattern has coordinates 1.0854 with the upper limit 1.0854/1.0852
The M5 and M15 time frames may have more false entry points.
Открыть график инструмента в новом окне
Bearish Symmetrical Triangle
сформирован 20.03 в 13:15:51 (UTC+0)
сила сигнала 1 из 5
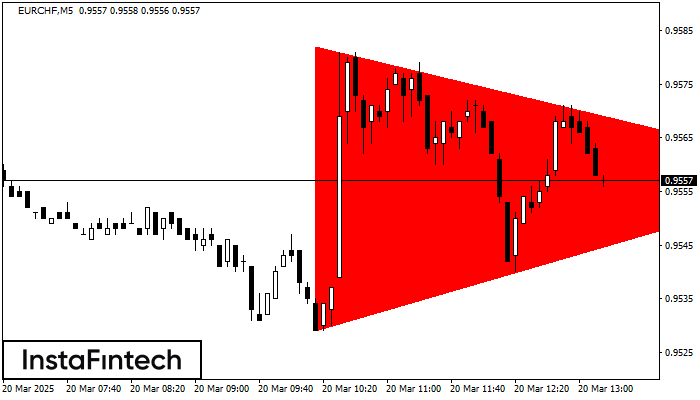
According to the chart of M5, EURCHF formed the Bearish Symmetrical Triangle pattern. Description: The lower border is 0.9529/0.9558 and upper border is 0.9582/0.9558. The pattern width is measured
The M5 and M15 time frames may have more false entry points.
Открыть график инструмента в новом окне
Bearish Rectangle
сформирован 20.03 в 12:57:40 (UTC+0)
сила сигнала 1 из 5
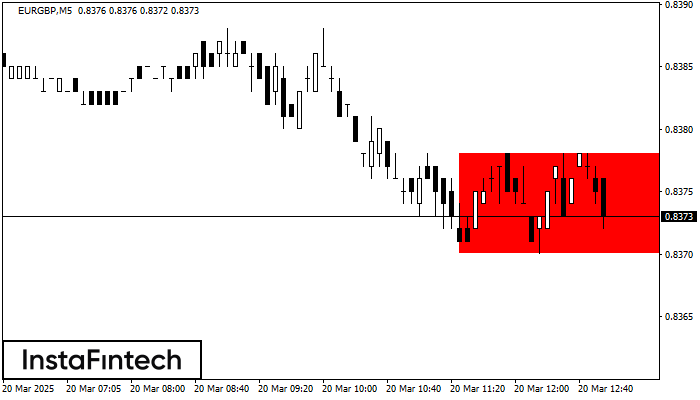
According to the chart of M5, EURGBP formed the Bearish Rectangle which is a pattern of a trend continuation. The pattern is contained within the following borders: lower border 0.8370
The M5 and M15 time frames may have more false entry points.
Открыть график инструмента в новом окне