

Өзекті паттерндер

Двойная вершина
сформирован 18.03 в 12:15:12 (UTC+0)
сила сигнала 1 из 5
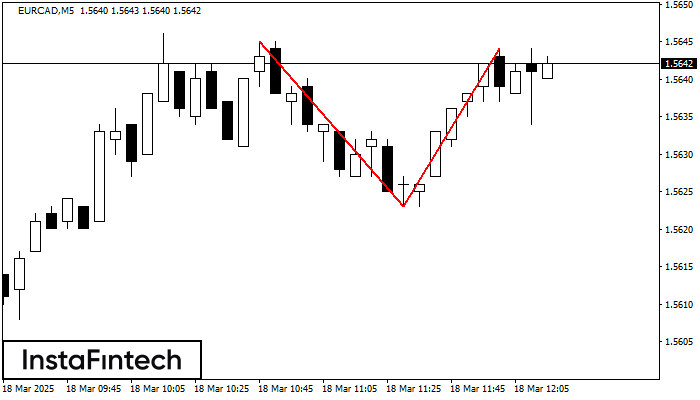
По EURCAD на M5 сформировалась разворотная фигура «Двойная вершина». Характеристика: Верхняя граница 1.5645; Нижняя граница 1.5623; Ширина фигуры 21 пунктов. Позицию на продажу возможно открыть ниже нижней границы 1.5623, с перспективой хода к уровню 1.5608.
Таймфреймы М5 и М15 могут иметь больше ложных точек входа.
- Все
- Все
- Bearish Rectangle
- Bearish Symmetrical Triangle
- Bearish Symmetrical Triangle
- Bullish Rectangle
- Double Top
- Double Top
- Triple Bottom
- Triple Bottom
- Triple Top
- Triple Top
- Все
- Все
- Покупка
- Продажа
- Все
- 1
- 2
- 3
- 4
- 5
Double Bottom
was formed on 19.03 at 22:35:27 (UTC+0)
signal strength 1 of 5
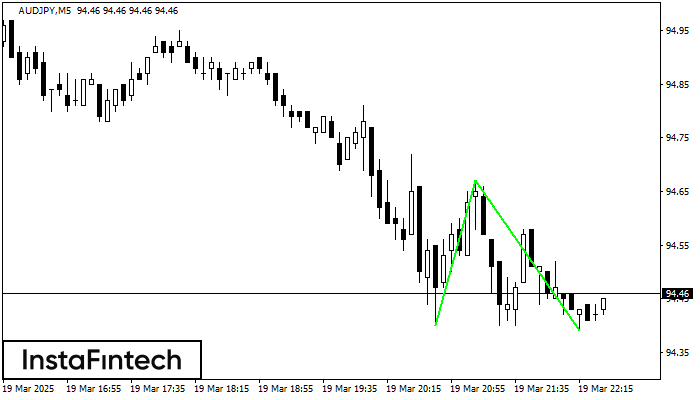
The Double Bottom pattern has been formed on AUDJPY M5. Characteristics: the support level 94.40; the resistance level 94.67; the width of the pattern 27 points. If the resistance level
The M5 and M15 time frames may have more false entry points.
Open chart in a new window
Triple Bottom
was formed on 19.03 at 22:35:27 (UTC+0)
signal strength 1 of 5
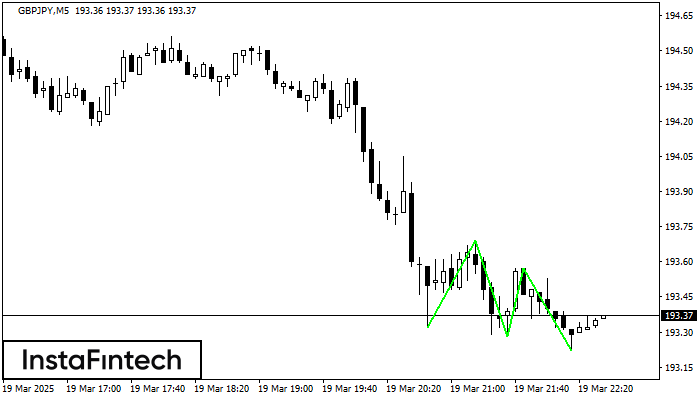
The Triple Bottom pattern has been formed on GBPJPY M5. It has the following characteristics: resistance level 193.69/193.57; support level 193.32/193.22; the width is 37 points. In the event
The M5 and M15 time frames may have more false entry points.
Open chart in a new window
Bullish Symmetrical Triangle
was formed on 19.03 at 22:31:16 (UTC+0)
signal strength 1 of 5
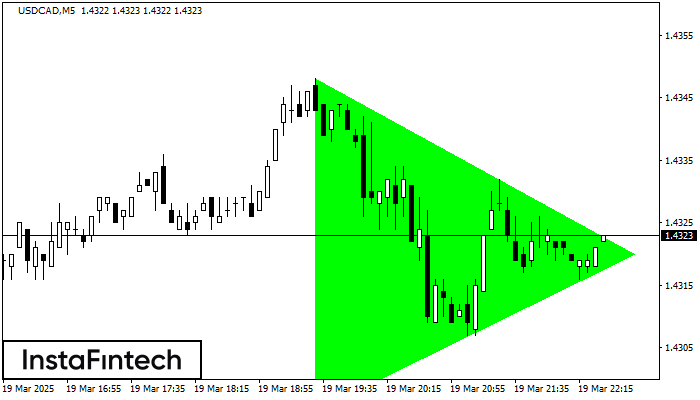
According to the chart of M5, USDCAD formed the Bullish Symmetrical Triangle pattern, which signals the trend will continue. Description. The upper border of the pattern touches the coordinates 1.4348/1.4320
The M5 and M15 time frames may have more false entry points.
Open chart in a new window


