

Өзекті паттерндер

Двойная вершина
сформирован 18.03 в 10:45:20 (UTC+0)
сила сигнала 2 из 5
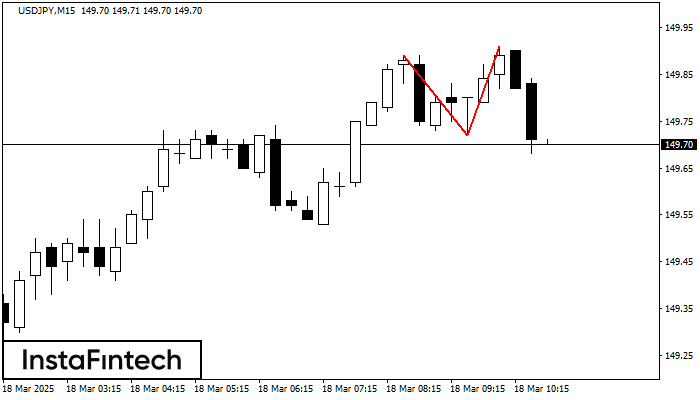
На торговом графике USDJPY M15 сформировалась разворотная фигура «Двойная вершина». Характеристика: Верхняя граница 149.91; Нижняя граница 149.72; Ширина фигуры 19 пунктов. Сигнал: Пробой нижней границы 149.72 приведет к дальнейшему нисходящему движению с перспективой хода к уровню 149.49.
Таймфреймы М5 и М15 могут иметь больше ложных точек входа.
- Все
- Все
- Bearish Rectangle
- Bearish Symmetrical Triangle
- Bearish Symmetrical Triangle
- Bullish Rectangle
- Double Top
- Double Top
- Triple Bottom
- Triple Bottom
- Triple Top
- Triple Top
- Все
- Все
- Покупка
- Продажа
- Все
- 1
- 2
- 3
- 4
- 5
Bullish Flag
was formed on 19.03 at 22:51:00 (UTC+0)
signal strength 1 of 5
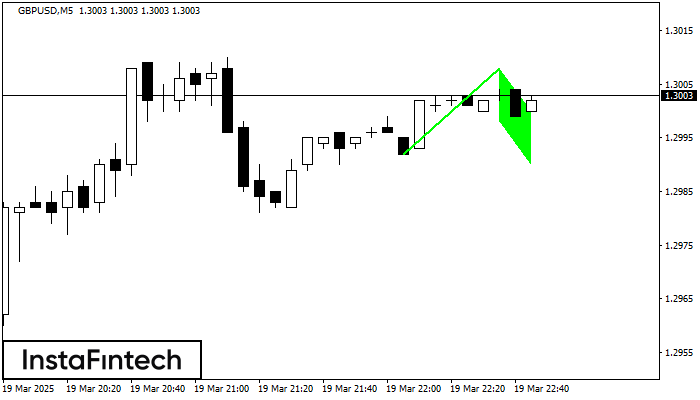
The Bullish Flag pattern which signals continuation of a trend has been formed on the chart GBPUSD M5. Forecast: if the price breaks above the pattern high at 1.3008, then
The M5 and M15 time frames may have more false entry points.
Open chart in a new window
Bullish pennant
was formed on 19.03 at 22:50:55 (UTC+0)
signal strength 1 of 5
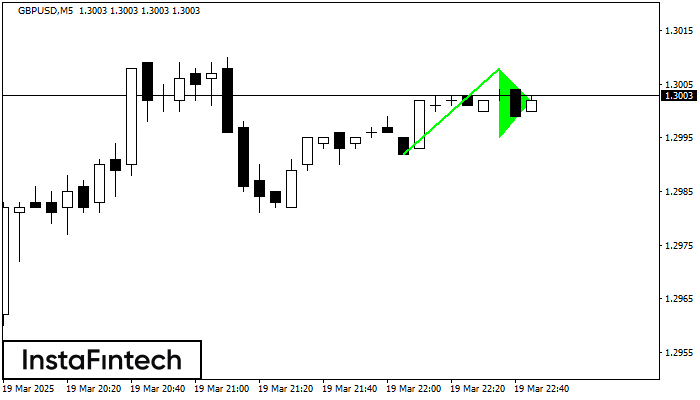
The Bullish pennant graphic pattern has formed on the GBPUSD M5 instrument. This pattern type falls under the category of continuation patterns. In this case, if the quote can breaks
The M5 and M15 time frames may have more false entry points.
Open chart in a new window
Double Bottom
was formed on 19.03 at 22:35:27 (UTC+0)
signal strength 1 of 5
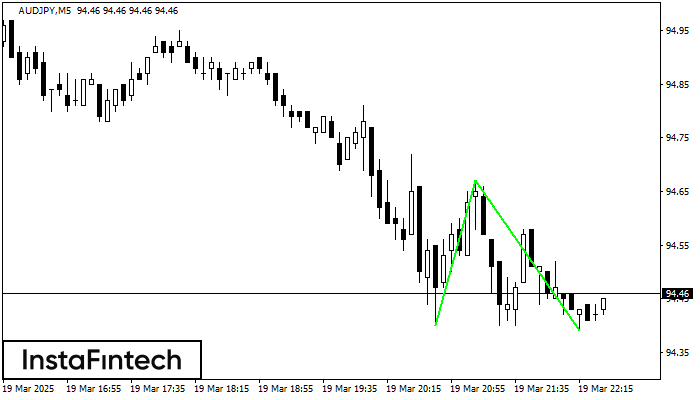
The Double Bottom pattern has been formed on AUDJPY M5. Characteristics: the support level 94.40; the resistance level 94.67; the width of the pattern 27 points. If the resistance level
The M5 and M15 time frames may have more false entry points.
Open chart in a new window


