

Өзекті паттерндер

Тройная вершина
сформирован 18.03 в 04:30:36 (UTC+0)
сила сигнала 2 из 5
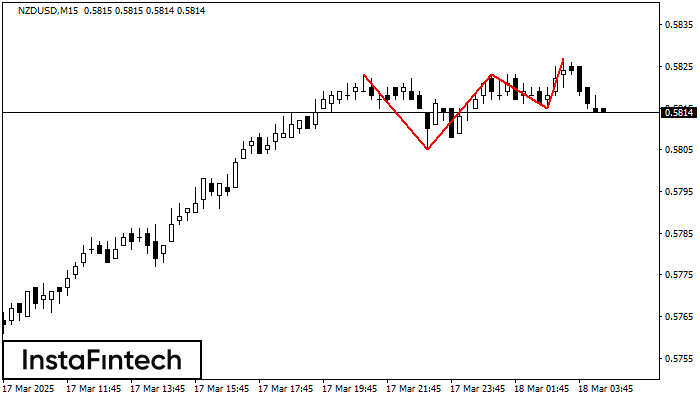
На графике NZDUSD M15 образовалась фигура «Тройная вершина». Данная фигура относится к типу разворотных и имеет характеристику: Верхняя граница 0.5823/0.5827; Нижняя граница 0.5805/0.5815; Ширина фигуры 8 пунктов. Прогноз: В случае пробоя нижней границы 0.5805 вероятно дальнейшее нисходящее движение к уровню 0.5800.
Таймфреймы М5 и М15 могут иметь больше ложных точек входа.
Сондай-ақ қараңыз
- Все
- Все
- Bearish Rectangle
- Bearish Symmetrical Triangle
- Bearish Symmetrical Triangle
- Bullish Rectangle
- Double Top
- Double Top
- Triple Bottom
- Triple Bottom
- Triple Top
- Triple Top
- Все
- Все
- Покупка
- Продажа
- Все
- 1
- 2
- 3
- 4
- 5
Head and Shoulders
was formed on 18.03 at 16:00:01 (UTC+0)
signal strength 3 of 5
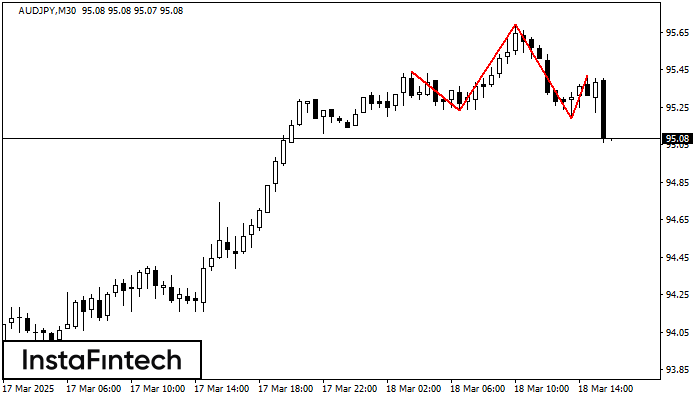
According to the chart of M30, AUDJPY formed the Head and Shoulders pattern. The Head’s top is set at 95.69 while the median line of the Neck is found
Open chart in a new window
Double Top
was formed on 18.03 at 15:59:41 (UTC+0)
signal strength 3 of 5
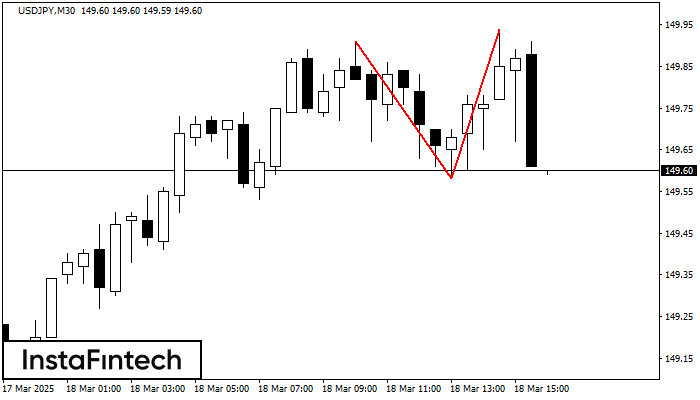
The Double Top reversal pattern has been formed on USDJPY M30. Characteristics: the upper boundary 149.91; the lower boundary 149.58; the width of the pattern is 36 points. Sell trades
Open chart in a new window
Head and Shoulders
was formed on 18.03 at 15:59:40 (UTC+0)
signal strength 3 of 5
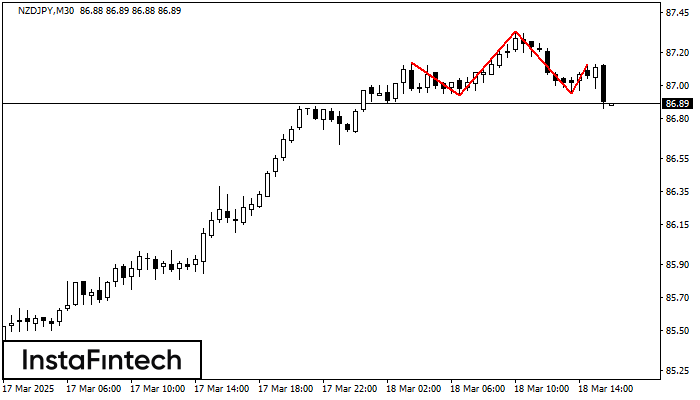
The NZDJPY M30 formed the Head and Shoulders pattern with the following features: The Head’s top is at 87.33, the Neckline and the upward angle are at 86.94/86.95. The formation
Open chart in a new window


