

Өзекті паттерндер

Бычий симметричный треугольник
сформирован 18.03 в 00:00:11 (UTC+0)
сила сигнала 2 из 5
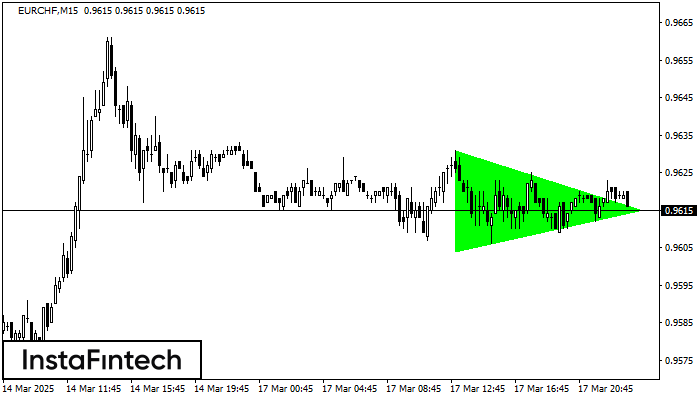
По EURCHF на M15 фигура «Бычий симметричный треугольник». Характеристика: Фигура продолжения тренда; Координаты границ – верхняя 0.9631, нижняя 0.9604. Проекция ширины фигуры 27 пунктов. Прогноз: В случае пробоя верхней границы 0.9631 цена, вероятнее всего, продолжит движение к 0.9638.
Таймфреймы М5 и М15 могут иметь больше ложных точек входа.
Сондай-ақ қараңыз
- Все
- Все
- Bearish Rectangle
- Bearish Symmetrical Triangle
- Bearish Symmetrical Triangle
- Bullish Rectangle
- Double Top
- Double Top
- Triple Bottom
- Triple Bottom
- Triple Top
- Triple Top
- Все
- Все
- Покупка
- Продажа
- Все
- 1
- 2
- 3
- 4
- 5
Inverse Head and Shoulder
сформирован 21.03 в 03:45:24 (UTC+0)
сила сигнала 1 из 5
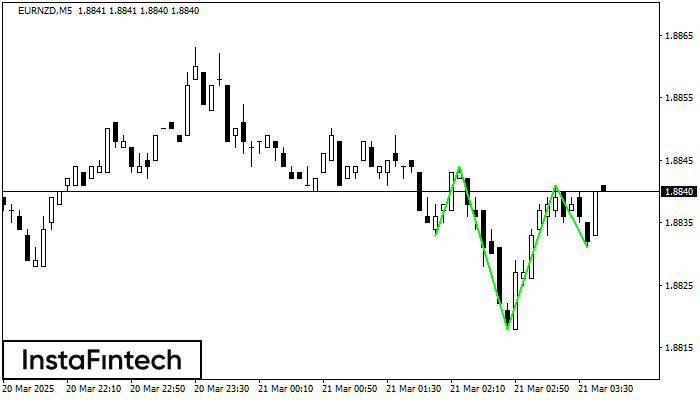
According to the chart of M5, EURNZD formed the Inverse Head and Shoulder pattern. The Head’s top is set at 1.8841 while the median line of the Neck is found
The M5 and M15 time frames may have more false entry points.
Открыть график инструмента в новом окне
Double Bottom
сформирован 21.03 в 03:20:20 (UTC+0)
сила сигнала 1 из 5
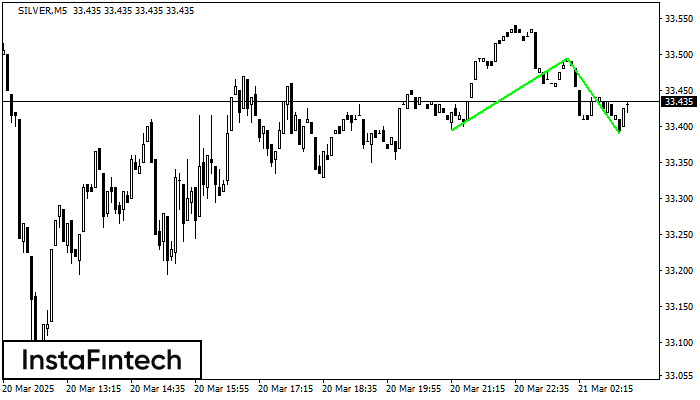
The Double Bottom pattern has been formed on SILVER M5. Characteristics: the support level 33.40; the resistance level 33.49; the width of the pattern 100 points. If the resistance level
The M5 and M15 time frames may have more false entry points.
Открыть график инструмента в новом окне
Double Bottom
сформирован 21.03 в 03:15:41 (UTC+0)
сила сигнала 2 из 5
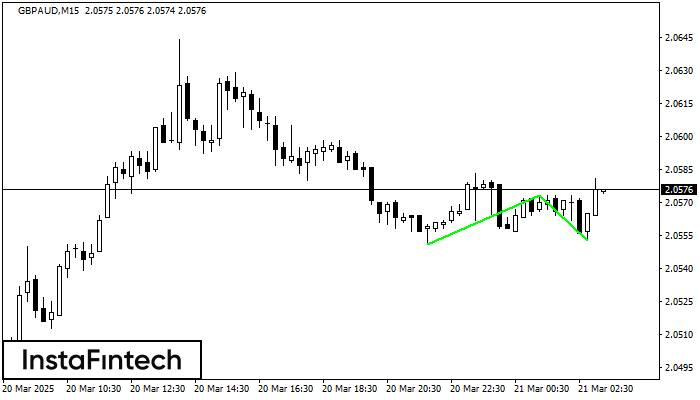
The Double Bottom pattern has been formed on GBPAUD M15; the upper boundary is 2.0573; the lower boundary is 2.0553. The width of the pattern is 22 points. In case
The M5 and M15 time frames may have more false entry points.
Открыть график инструмента в новом окне


