

Actual patterns

Patterns are graphical models which are formed in the chart by the price. According to one of the technical analysis postulates, history (price movement) repeats itself. It means that the price movements are often similar in the same situations which makes it possible to predict the further development of the situation with a high probability.
Relevant patterns by InstaTrade is an easy-to-use service which allows you to be aware of latest changes in the market and react to clues from the market in time. In our service you will always find the latest and most relevant patterns on any pair and any timeframe.
Bullish Symmetrical Triangle
was formed on 21.03 at 20:20:31 (UTC+0)
signal strength 1 of 5

According to the chart of M5, #GOOG formed the Bullish Symmetrical Triangle pattern, which signals the trend will continue. Description. The upper border of the pattern touches the coordinates 165.68/165.13 whereas the lower border goes across 164.59/165.13. The pattern width is measured on the chart at 109 pips. If the Bullish Symmetrical Triangle pattern is in progress during the upward trend, this indicates the current trend will go on. In case 165.13 is broken, the price could continue its move toward 165.28.
The M5 and M15 time frames may have more false entry points.
See Also
- All
- All
- Bearish Rectangle
- Bearish Symmetrical Triangle
- Bearish Symmetrical Triangle
- Bullish Rectangle
- Double Top
- Double Top
- Triple Bottom
- Triple Bottom
- Triple Top
- Triple Top
- All
- All
- Buy
- Sale
- All
- 1
- 2
- 3
- 4
- 5
รูปแบบกราฟจุดสามยอด (Triple Top)
was formed on 24.03 at 23:01:00 (UTC+0)
signal strength 1 of 5

รูปแบบ รูปแบบกราฟจุดสามยอด (Triple Top) ได้สร้างขึ้นมาในชาร์ตของ EURJPY M5 คุณลักษณะของกราฟรูปแบบนี้: ขอบเขตมีมุมหงายขึ้น; เส้นด้านล่างของกราฟรูปแบบนี้มีพิกัดอยู่ที่ 162.59/162.72 พร้อมกับลิมิตขาขึ้น 162.78/162.77; ระยะของความกว้างคือ
ขอบเตระยะเวลาใน M5 และ M15 อาจจะมีตำแหน่งการเข้าใช้งานที่ผิดพลาดมากยิ่งขึ้น
Open chart in a new window
รูปแบบกราฟธงขาขึ้น (Bullish Flag)
was formed on 24.03 at 23:00:23 (UTC+0)
signal strength 2 of 5

รูปแบบ รูปแบบกราฟธงขาขึ้น (Bullish Flag) ได้สร้างขึ้นมามาในชาร์ต NZDJPY M15 ซึ่งแสดงให้เห็นว่า แนวโน้มขาขึ้นจะเกิดขึ้นต่อไป สัญญาณ: การเคลื่อนตัวทะลุผ่านระดับสูงสุดที่ 86.28 อาจจะผลักดันราคาให้สูงขึ้นกว่าเดิม และการปรับตัวขึ้นจะเป็นระยะทางไปยังตัวเสา
ขอบเตระยะเวลาใน M5 และ M15 อาจจะมีตำแหน่งการเข้าใช้งานที่ผิดพลาดมากยิ่งขึ้น
Open chart in a new window
รูปแบบสามเหลี่ยมสมมาตรขาขึ้น (Bullish Symmetrical Triangle)
was formed on 24.03 at 23:00:22 (UTC+0)
signal strength 1 of 5
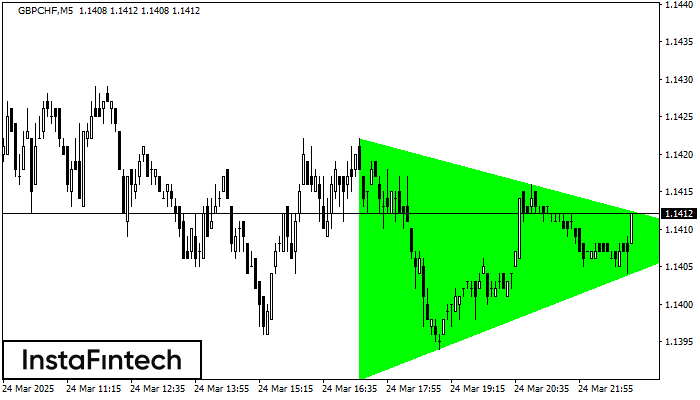
อ้างอิงจากชาร์ตของ M5, GBPCHF ที่ได้สร้างรูปแบบ รูปแบบสามเหลี่ยมสมมาตรขาขึ้น (Bullish Symmetrical Triangle) ออกมา คำอธิบาย: นี้คือรูปแบบของความต่อเนื่องในแนวโน้ม 1.1422 และ 1.1390 เป็นพิกัดของขอบเขตด้านบนและด้านล่าง
ขอบเตระยะเวลาใน M5 และ M15 อาจจะมีตำแหน่งการเข้าใช้งานที่ผิดพลาดมากยิ่งขึ้น
Open chart in a new window


