

वास्तविक पैटर्न

पैटर्न ग्राफिकल मॉडल हैं जो चार्ट में मूल्य से बने होते हैं। तकनीकी विश्लेषण भविष्यवाणियों में से एक के अनुसार, इतिहास का मतलब मूल्य आंदोलन खुद को दोहराता है। इसका मतलब है कि मूल्य आंदोलन अक्सर एक ही परिस्थितियों में समान होते हैं जो उच्च संभावना के साथ स्थिति के आगे के विकास की भविष्यवाणी करना संभव बनाता है।
इंस्टा फॉरेक्स द्वारा प्रासंगिक पैटर्न एक उपयोग में आसान सेवा है जो आपको बाजार में नवीनतम परिवर्तनों के बारे में जागरूक होने और समय पर बाजार से संकेतों पर प्रतिक्रिया करने की अनुमति देती है। हमारी सेवा में आप हमेशा किसी भी जोड़ी और किसी भी समय सीमा पर नवीनतम और सबसे प्रासंगिक पैटर्न प्राप्त कर सकते हैं.
Bullish Symmetrical Triangle
was formed on 01.04 at 11:03:47 (UTC+0)
signal strength 3 of 5

According to the chart of M30, GBPUSD formed the Bullish Symmetrical Triangle pattern. The lower border of the pattern touches the coordinates 1.2876/1.2915 whereas the upper border goes across 1.2971/1.2915. If the Bullish Symmetrical Triangle pattern is in progress, this evidently signals a further upward trend. In other words, in case the scenario comes true, the price of GBPUSD will breach the upper border to head for 1.2945.
See Also
- All
- All
- Bearish Rectangle
- Bearish Symmetrical Triangle
- Bearish Symmetrical Triangle
- Bullish Rectangle
- Double Top
- Double Top
- Triple Bottom
- Triple Bottom
- Triple Top
- Triple Top
- All
- All
- Buy
- Sale
- All
- 1
- 2
- 3
- 4
- 5
Double Top
was formed on 14.04 at 14:05:46 (UTC+0)
signal strength 1 of 5
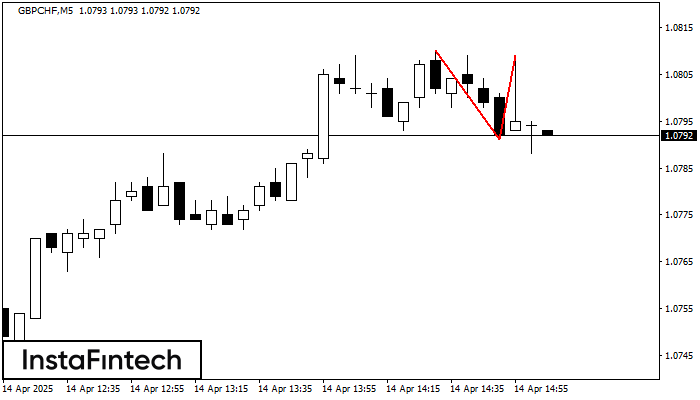
The Double Top reversal pattern has been formed on GBPCHF M5. Characteristics: the upper boundary 1.0810; the lower boundary 1.0791; the width of the pattern is 18 points. Sell trades
The M5 and M15 time frames may have more false entry points.
Open chart in a new window
Bullish Rectangle
was formed on 14.04 at 13:57:45 (UTC+0)
signal strength 1 of 5
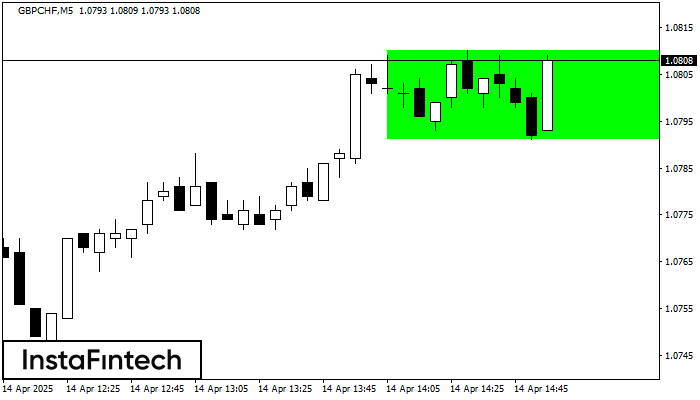
According to the chart of M5, GBPCHF formed the Bullish Rectangle. The pattern indicates a trend continuation. The upper border is 1.0810, the lower border is 1.0791. The signal means
The M5 and M15 time frames may have more false entry points.
Open chart in a new window
Triple Top
was formed on 14.04 at 13:55:08 (UTC+0)
signal strength 1 of 5
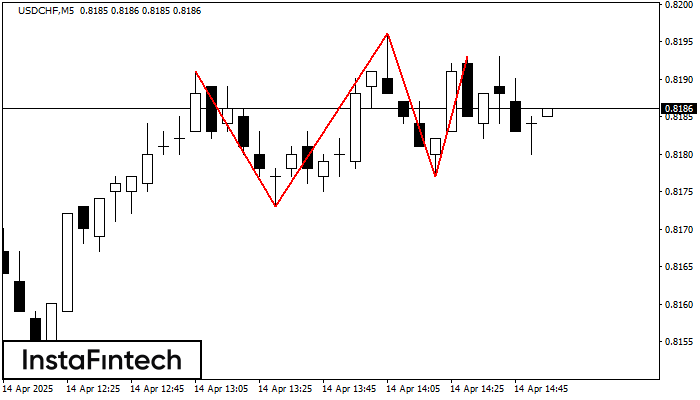
The Triple Top pattern has formed on the chart of the USDCHF M5 trading instrument. It is a reversal pattern featuring the following characteristics: resistance level -2, support level -4
The M5 and M15 time frames may have more false entry points.
Open chart in a new window


