वास्तविक पैटर्न

पैटर्न ग्राफिकल मॉडल हैं जो चार्ट में मूल्य से बने होते हैं। तकनीकी विश्लेषण भविष्यवाणियों में से एक के अनुसार, इतिहास का मतलब मूल्य आंदोलन खुद को दोहराता है। इसका मतलब है कि मूल्य आंदोलन अक्सर एक ही परिस्थितियों में समान होते हैं जो उच्च संभावना के साथ स्थिति के आगे के विकास की भविष्यवाणी करना संभव बनाता है।
इंस्टा फॉरेक्स द्वारा प्रासंगिक पैटर्न एक उपयोग में आसान सेवा है जो आपको बाजार में नवीनतम परिवर्तनों के बारे में जागरूक होने और समय पर बाजार से संकेतों पर प्रतिक्रिया करने की अनुमति देती है। हमारी सेवा में आप हमेशा किसी भी जोड़ी और किसी भी समय सीमा पर नवीनतम और सबसे प्रासंगिक पैटर्न प्राप्त कर सकते हैं.
Double Top
was formed on 25.03 at 04:00:34 (UTC+0)
signal strength 2 of 5
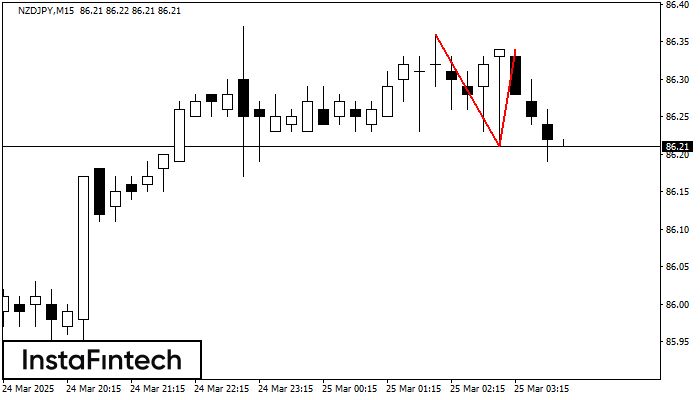
On the chart of NZDJPY M15 the Double Top reversal pattern has been formed. Characteristics: the upper boundary 86.34; the lower boundary 86.21; the width of the pattern 13 points. The signal: a break of the lower boundary will cause continuation of the downward trend targeting the 85.99 level.
The M5 and M15 time frames may have more false entry points.
See Also
- All
- All
- Bearish Rectangle
- Bearish Symmetrical Triangle
- Bearish Symmetrical Triangle
- Bullish Rectangle
- Double Top
- Double Top
- Triple Bottom
- Triple Bottom
- Triple Top
- Triple Top
- All
- All
- Buy
- Sale
- All
- 1
- 2
- 3
- 4
- 5
ट्रिपल टॉप
was formed on 30.03 at 23:45:26 (UTC+0)
signal strength 2 of 5
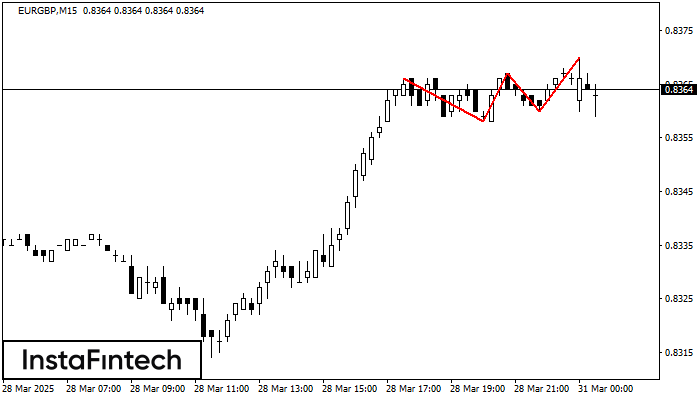
EURGBP M15 के चार्ट पर ट्रिपल टॉप पैटर्न बना है। पैटर्न की विशेषताएं: सीमाओं में एक आरोही कोण मौजूद है; पैटर्न की निचली रेखा 0.8358/0.8360 पर है और ऊपरी सीमा
M5 और M15 समय सीमा में अधिक फाल्स एंट्री पॉइंट्स हो सकते हैं।
Open chart in a new window
बियरिश पताका
was formed on 30.03 at 23:26:32 (UTC+0)
signal strength 1 of 5

बियरिश पताका पैटर्न AUDCHF M5 चार्ट पर बना है। यदि पताका का 0.5526 निम्न स्तर टूट जाता है, तो पैटर्न डाउनट्रेंड के जारी रहने का संकेत देता है। अनुशंसाएं: पैटर्न
M5 और M15 समय सीमा में अधिक फाल्स एंट्री पॉइंट्स हो सकते हैं।
Open chart in a new window
डबल टॉप
was formed on 30.03 at 23:15:27 (UTC+0)
signal strength 2 of 5
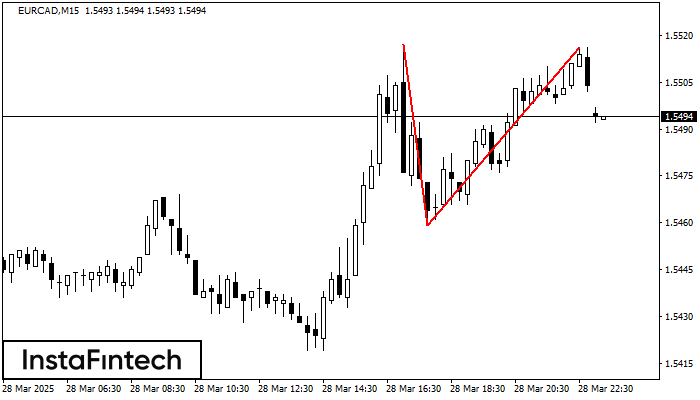
डबल टॉप पैटर्न EURCAD M15 पर बना है। यह संकेत देता है कि प्रवृत्ति ऊपर से नीचे की ओर बदल गई है। संभवतः, यदि 1.5459 पैटर्न का आधार टूट जाता
M5 और M15 समय सीमा में अधिक फाल्स एंट्री पॉइंट्स हो सकते हैं।
Open chart in a new window