

वास्तविक पैटर्न

पैटर्न ग्राफिकल मॉडल हैं जो चार्ट में मूल्य से बने होते हैं। तकनीकी विश्लेषण भविष्यवाणियों में से एक के अनुसार, इतिहास का मतलब मूल्य आंदोलन खुद को दोहराता है। इसका मतलब है कि मूल्य आंदोलन अक्सर एक ही परिस्थितियों में समान होते हैं जो उच्च संभावना के साथ स्थिति के आगे के विकास की भविष्यवाणी करना संभव बनाता है।
इंस्टा फॉरेक्स द्वारा प्रासंगिक पैटर्न एक उपयोग में आसान सेवा है जो आपको बाजार में नवीनतम परिवर्तनों के बारे में जागरूक होने और समय पर बाजार से संकेतों पर प्रतिक्रिया करने की अनुमति देती है। हमारी सेवा में आप हमेशा किसी भी जोड़ी और किसी भी समय सीमा पर नवीनतम और सबसे प्रासंगिक पैटर्न प्राप्त कर सकते हैं.
Double Bottom
was formed on 21.03 at 01:40:25 (UTC+0)
signal strength 1 of 5
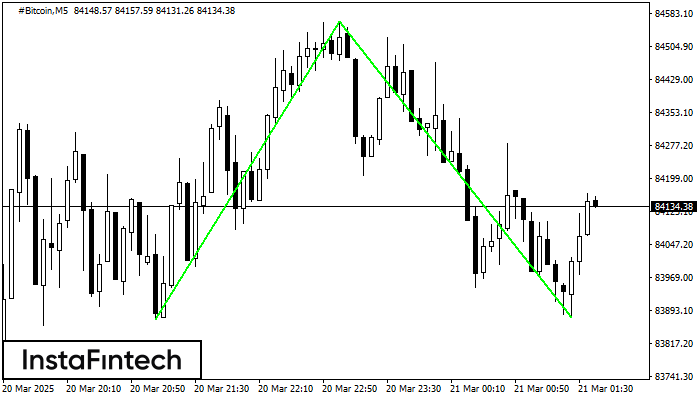
The Double Bottom pattern has been formed on #Bitcoin M5; the upper boundary is 84563.99; the lower boundary is 83877.64. The width of the pattern is 69121 points. In case of a break of the upper boundary 84563.99, a change in the trend can be predicted where the width of the pattern will coincide with the distance to a possible take profit level.
The M5 and M15 time frames may have more false entry points.
See Also
- All
- All
- Bearish Rectangle
- Bearish Symmetrical Triangle
- Bearish Symmetrical Triangle
- Bullish Rectangle
- Double Top
- Double Top
- Triple Bottom
- Triple Bottom
- Triple Top
- Triple Top
- All
- All
- Buy
- Sale
- All
- 1
- 2
- 3
- 4
- 5
Double Top
was formed on 31.03 at 10:30:55 (UTC+0)
signal strength 3 of 5
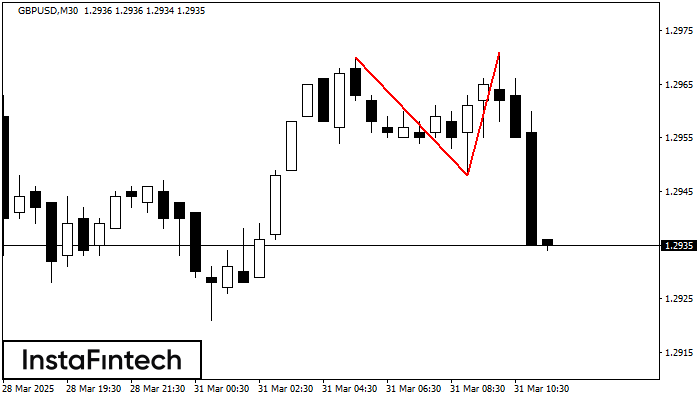
Corak pembalikan Double Top telah dibentuk pada GBPUSD M30. Ciri-ciri: sempadan atas %P0.000000; sempadan bawah 1.2970; sempadan bawah 1.2948; lebar corak adalah 23 mata. Dagangan menjual adalah lebih baik untuk
Open chart in a new window
Triple Top
was formed on 31.03 at 10:00:28 (UTC+0)
signal strength 3 of 5

Pada carta instrumen dagangan EURUSD M30, corak Triple Top yang menandakan perubahan aliran telah terbentuk. Adalah mungkin bahawa selepas pembentukan bahagian atas ketiga, harga akan cuba menembusi tahap rintangan 1.0805
Open chart in a new window
Double Bottom
was formed on 31.03 at 10:00:26 (UTC+0)
signal strength 3 of 5

Corak Double Bottom telah dibentuk pada USDJPY M30. Pembentukan ini menandakan pembalikan aliran dari aliran menurun ke atas. Isyarat ialah perdagangan membeli harus dibuka selepas sempadan atas corak 149.26 telah
Open chart in a new window


