

वास्तविक पैटर्न

पैटर्न ग्राफिकल मॉडल हैं जो चार्ट में मूल्य से बने होते हैं। तकनीकी विश्लेषण भविष्यवाणियों में से एक के अनुसार, इतिहास का मतलब मूल्य आंदोलन खुद को दोहराता है। इसका मतलब है कि मूल्य आंदोलन अक्सर एक ही परिस्थितियों में समान होते हैं जो उच्च संभावना के साथ स्थिति के आगे के विकास की भविष्यवाणी करना संभव बनाता है।
इंस्टा फॉरेक्स द्वारा प्रासंगिक पैटर्न एक उपयोग में आसान सेवा है जो आपको बाजार में नवीनतम परिवर्तनों के बारे में जागरूक होने और समय पर बाजार से संकेतों पर प्रतिक्रिया करने की अनुमति देती है। हमारी सेवा में आप हमेशा किसी भी जोड़ी और किसी भी समय सीमा पर नवीनतम और सबसे प्रासंगिक पैटर्न प्राप्त कर सकते हैं.
Triple Top
was formed on 18.03 at 12:30:10 (UTC+0)
signal strength 3 of 5
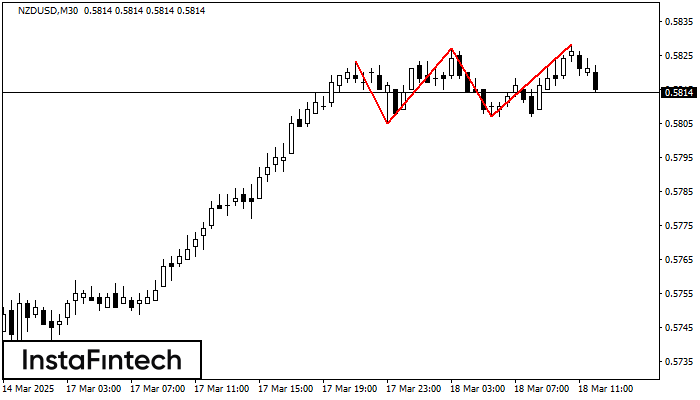
The Triple Top pattern has formed on the chart of the NZDUSD M30. Features of the pattern: borders have an ascending angle; the lower line of the pattern has the coordinates 0.5805/0.5807 with the upper limit 0.5823/0.5828; the projection of the width is 18 points. The formation of the Triple Top figure most likely indicates a change in the trend from upward to downward. This means that in the event of a breakdown of the support level of 0.5805, the price is most likely to continue the downward movement.
See Also
- All
- All
- Bearish Rectangle
- Bearish Symmetrical Triangle
- Bearish Symmetrical Triangle
- Bullish Rectangle
- Double Top
- Double Top
- Triple Bottom
- Triple Bottom
- Triple Top
- Triple Top
- All
- All
- Buy
- Sale
- All
- 1
- 2
- 3
- 4
- 5
डबल टॉप
was formed on 21.03 at 00:00:09 (UTC+0)
signal strength 2 of 5
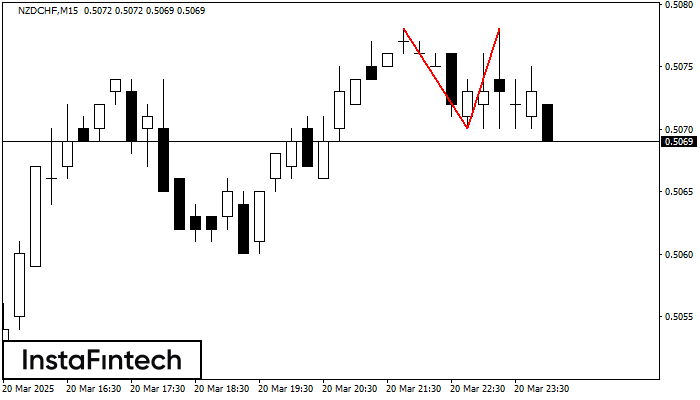
डबल टॉप पैटर्न NZDCHF M15 पर बना है। यह संकेत देता है कि प्रवृत्ति ऊपर से नीचे की ओर बदल गई है। संभवतः, यदि 0.5070 पैटर्न का आधार टूट जाता
M5 और M15 समय सीमा में अधिक फाल्स एंट्री पॉइंट्स हो सकते हैं।
Open chart in a new window
डबल टॉप
was formed on 20.03 at 23:00:52 (UTC+0)
signal strength 1 of 5
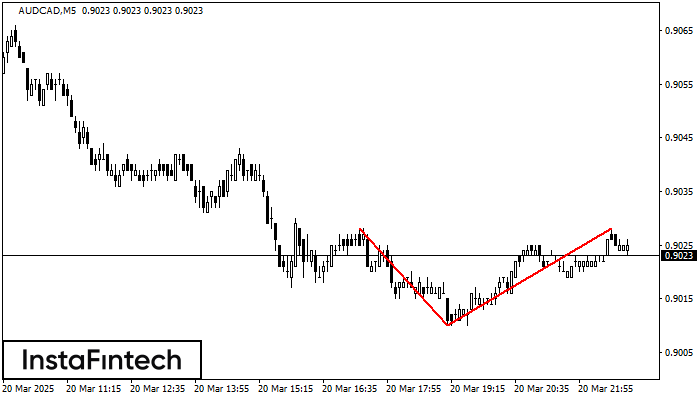
AUDCAD M5 पर डबल टॉप रीवर्सल पैटर्न बना है। विशेषताएं: ऊपरी सीमा 0.9028; निचली सीमा 0.9010; पैटर्न की चौड़ाई 18 पॉइंट्स है। सेल ट्रेडों को 0.9010 की निचली सीमा के
M5 और M15 समय सीमा में अधिक फाल्स एंट्री पॉइंट्स हो सकते हैं।
Open chart in a new window
ट्रिपल टॉप
was formed on 20.03 at 22:55:12 (UTC+0)
signal strength 1 of 5
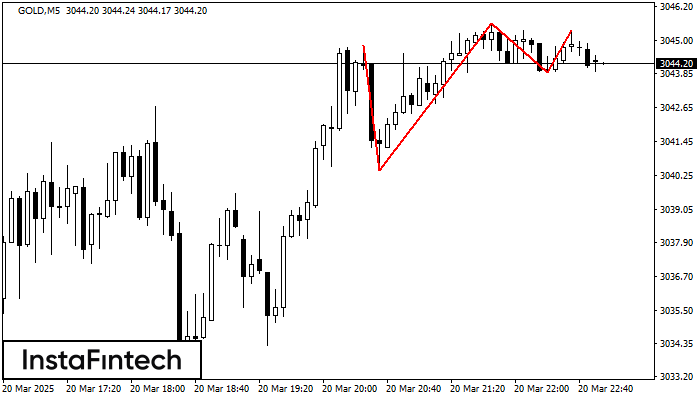
ट्रिपल टॉप पैटर्न GOLD M5 ट्रेडिंग इंस्ट्रूमेंट के चार्ट पर बना है। यह एक रीवर्सल पैटर्न है जिसमें निम्नलिखित विशेषताएं हैं: प्रतिरोध स्तर -50, समर्थन स्तर -345, और पैटर्न की
M5 और M15 समय सीमा में अधिक फाल्स एंट्री पॉइंट्स हो सकते हैं।
Open chart in a new window


