

वास्तविक पैटर्न

पैटर्न ग्राफिकल मॉडल हैं जो चार्ट में मूल्य से बने होते हैं। तकनीकी विश्लेषण भविष्यवाणियों में से एक के अनुसार, इतिहास का मतलब मूल्य आंदोलन खुद को दोहराता है। इसका मतलब है कि मूल्य आंदोलन अक्सर एक ही परिस्थितियों में समान होते हैं जो उच्च संभावना के साथ स्थिति के आगे के विकास की भविष्यवाणी करना संभव बनाता है।
इंस्टा फॉरेक्स द्वारा प्रासंगिक पैटर्न एक उपयोग में आसान सेवा है जो आपको बाजार में नवीनतम परिवर्तनों के बारे में जागरूक होने और समय पर बाजार से संकेतों पर प्रतिक्रिया करने की अनुमति देती है। हमारी सेवा में आप हमेशा किसी भी जोड़ी और किसी भी समय सीमा पर नवीनतम और सबसे प्रासंगिक पैटर्न प्राप्त कर सकते हैं.
Head and Shoulders
was formed on 18.03 at 12:04:52 (UTC+0)
signal strength 1 of 5
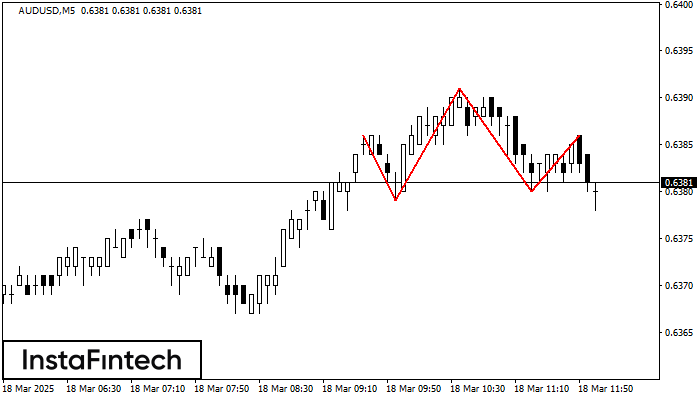
The technical pattern called Head and Shoulders has appeared on the chart of AUDUSD M5. There are weighty reasons to suggest that the price will surpass the Neckline 0.6379/0.6380 after the right shoulder has been formed. So, the trend is set to change with the price heading for 0.6365.
The M5 and M15 time frames may have more false entry points.
- All
- All
- Bearish Rectangle
- Bearish Symmetrical Triangle
- Bearish Symmetrical Triangle
- Bullish Rectangle
- Double Top
- Double Top
- Triple Bottom
- Triple Bottom
- Triple Top
- Triple Top
- All
- All
- Buy
- Sale
- All
- 1
- 2
- 3
- 4
- 5
डबल बॉटम
was formed on 19.03 at 22:35:27 (UTC+0)
signal strength 1 of 5
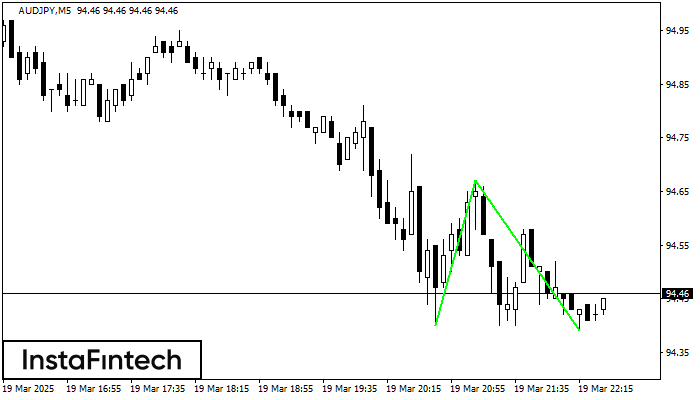
डबल बॉटम पैटर्न AUDJPY M5 पर बना है। विशेषताएं: समर्थन स्तर 94.40; प्रतिरोध स्तर 94.67; पैटर्न की चौड़ाई 27 पॉइंट्स। यदि प्रतिरोध स्तर टूट जाता है, तो रुझान में बदलाव
M5 और M15 समय सीमा में अधिक फाल्स एंट्री पॉइंट्स हो सकते हैं।
Open chart in a new window
ट्रिपल बॉटम
was formed on 19.03 at 22:35:27 (UTC+0)
signal strength 1 of 5
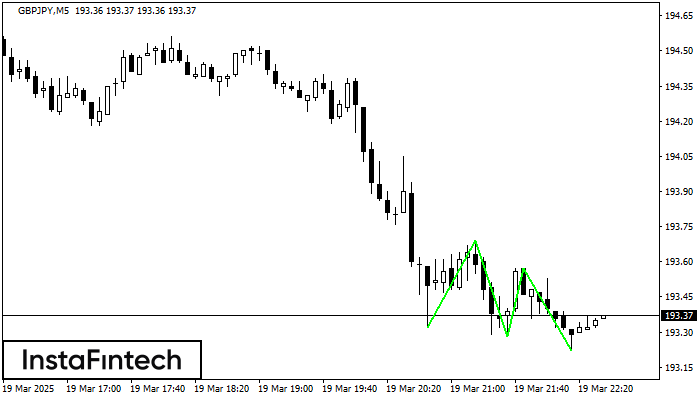
ट्रिपल बॉटम पैटर्न GBPJPY M5 पर बना है। इसकी निम्नलिखित विशेषताएं हैं: प्रतिरोध स्तर 193.69/193.57; समर्थन स्तर 193.32/193.22; चौड़ाई 37 पॉइंट्स है। 193.69 के प्रतिरोध स्तर के टूटने की स्थिति
M5 और M15 समय सीमा में अधिक फाल्स एंट्री पॉइंट्स हो सकते हैं।
Open chart in a new window
बुलिश सिमेट्रिकल त्रिभुज
was formed on 19.03 at 22:31:16 (UTC+0)
signal strength 1 of 5
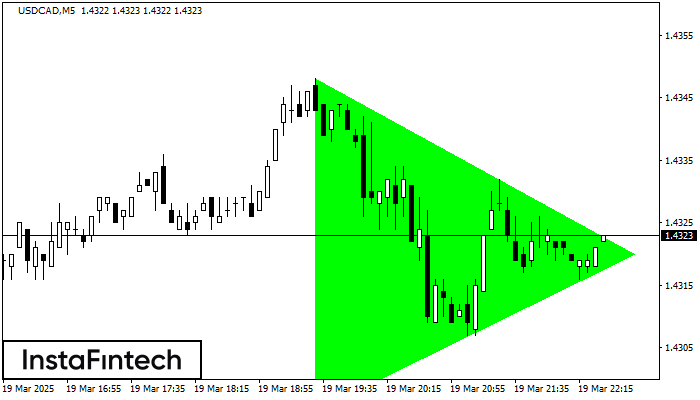
M5 के चार्ट के अनुसार, USDCAD से बुलिश सिमेट्रिकल त्रिभुज पैटर्न बना, जो दर्शाता है कि ट्रेंड जारी रहेगा। विवरण: पैटर्न की ऊपरी सीमा निर्देशांक 1.4348/1.4320 को स्पर्श करती है
M5 और M15 समय सीमा में अधिक फाल्स एंट्री पॉइंट्स हो सकते हैं।
Open chart in a new window


