

वास्तविक पैटर्न

पैटर्न ग्राफिकल मॉडल हैं जो चार्ट में मूल्य से बने होते हैं। तकनीकी विश्लेषण भविष्यवाणियों में से एक के अनुसार, इतिहास का मतलब मूल्य आंदोलन खुद को दोहराता है। इसका मतलब है कि मूल्य आंदोलन अक्सर एक ही परिस्थितियों में समान होते हैं जो उच्च संभावना के साथ स्थिति के आगे के विकास की भविष्यवाणी करना संभव बनाता है।
इंस्टा फॉरेक्स द्वारा प्रासंगिक पैटर्न एक उपयोग में आसान सेवा है जो आपको बाजार में नवीनतम परिवर्तनों के बारे में जागरूक होने और समय पर बाजार से संकेतों पर प्रतिक्रिया करने की अनुमति देती है। हमारी सेवा में आप हमेशा किसी भी जोड़ी और किसी भी समय सीमा पर नवीनतम और सबसे प्रासंगिक पैटर्न प्राप्त कर सकते हैं.
Bullish Rectangle
was formed on 18.03 at 03:13:05 (UTC+0)
signal strength 3 of 5
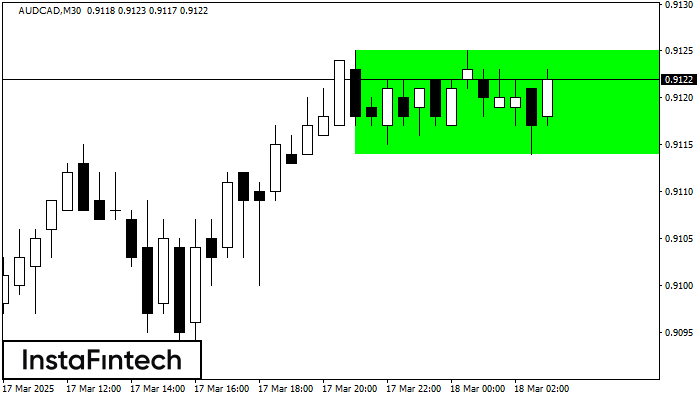
According to the chart of M30, AUDCAD formed the Bullish Rectangle which is a pattern of a trend continuation. The pattern is contained within the following borders: the lower border 0.9114 – 0.9114 and upper border 0.9125 – 0.9125. In case the upper border is broken, the instrument is likely to follow the upward trend.
- All
- All
- Bearish Rectangle
- Bearish Symmetrical Triangle
- Bearish Symmetrical Triangle
- Bullish Rectangle
- Double Top
- Double Top
- Triple Bottom
- Triple Bottom
- Triple Top
- Triple Top
- All
- All
- Buy
- Sale
- All
- 1
- 2
- 3
- 4
- 5
बियरिश पताका
was formed on 18.03 at 21:30:28 (UTC+0)
signal strength 4 of 5

बियरिश पताका पैटर्न #PEP H1 चार्ट पर बना है। यदि पताका का 149.11 निम्न स्तर टूट जाता है, तो पैटर्न डाउनट्रेंड के जारी रहने का संकेत देता है। अनुशंसाएं: पैटर्न
Open chart in a new window
बियरिश पताका
was formed on 18.03 at 21:30:27 (UTC+0)
signal strength 4 of 5
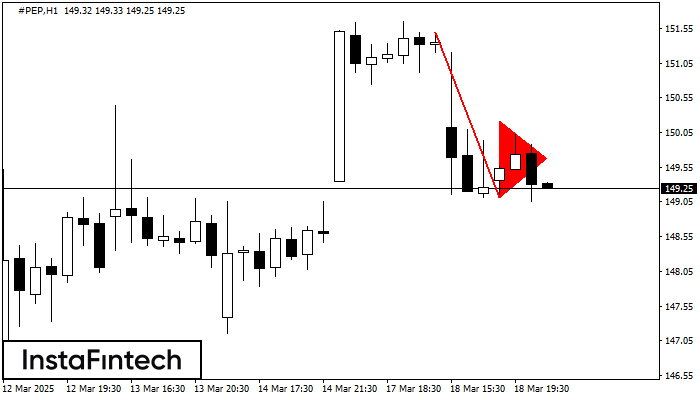
बियरिश पताका पैटर्न #PEP H1 चार्ट पर बना है। इस तरह के पैटर्न की विशेषता है कि एक मामूली मंदी के बाद कीमत मूल प्रवृत्ति की दिशा में आगे बढ़ती
Open chart in a new window
डबल टॉप
was formed on 18.03 at 21:30:24 (UTC+0)
signal strength 2 of 5
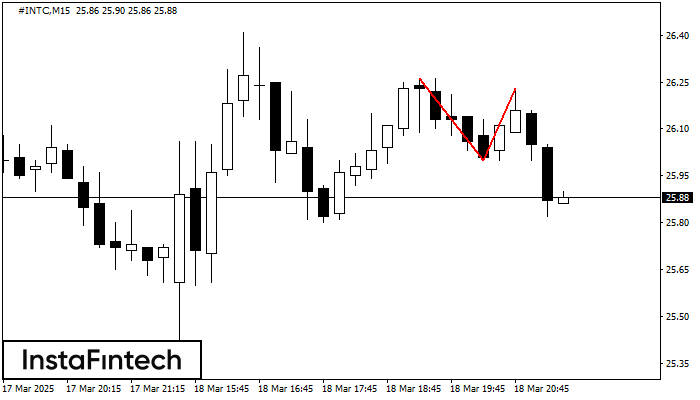
#INTC M15 के चार्ट पर डबल टॉप रीवर्सल पैटर्न बना है। विशेषताएं: ऊपरी सीमा 26.23; निचली सीमा 26.00; पैटर्न की चौड़ाई 23 पॉइंट्स। संकेत: निचली सीमा के टूटने से 25.77
M5 और M15 समय सीमा में अधिक फाल्स एंट्री पॉइंट्स हो सकते हैं।
Open chart in a new window


