

Pola sebenarnya

Double Top
was formed on 02.04 at 12:15:40 (UTC+0)
signal strength 2 of 5
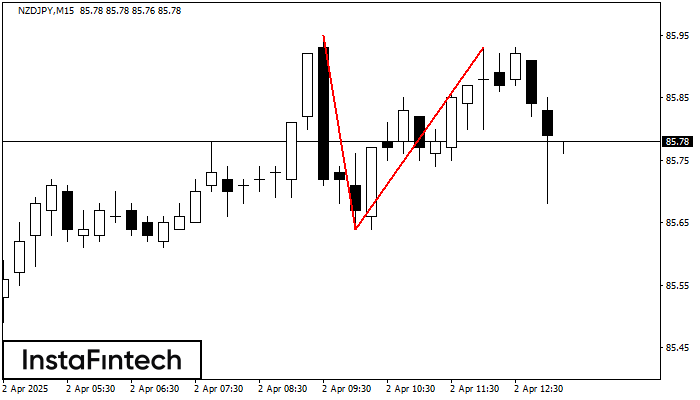
The Double Top reversal pattern has been formed on NZDJPY M15. Characteristics: the upper boundary 85.95; the lower boundary 85.64; the width of the pattern is 29 points. Sell trades are better to be opened below the lower boundary 85.64 with a possible movements towards the 85.42 level.
The M5 and M15 time frames may have more false entry points.
Lihat juga
- All
- All
- Bearish Rectangle
- Bearish Symmetrical Triangle
- Bearish Symmetrical Triangle
- Bullish Rectangle
- Double Top
- Double Top
- Triple Bottom
- Triple Bottom
- Triple Top
- Triple Top
- All
- All
- Buy
- Sale
- All
- 1
- 2
- 3
- 4
- 5
Bullish Symmetrical Triangle
was formed on 11.04 at 08:06:10 (UTC+0)
signal strength 1 of 5
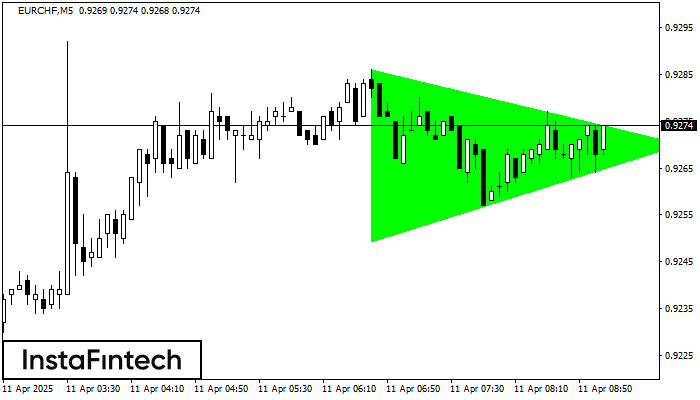
According to the chart of M5, EURCHF formed the Bullish Symmetrical Triangle pattern. The lower border of the pattern touches the coordinates 0.9249/0.9270 whereas the upper border goes across 0.9286/0.9270
The M5 and M15 time frames may have more false entry points.
Open chart in a new window
Inverse Head and Shoulder
was formed on 11.04 at 08:05:06 (UTC+0)
signal strength 1 of 5
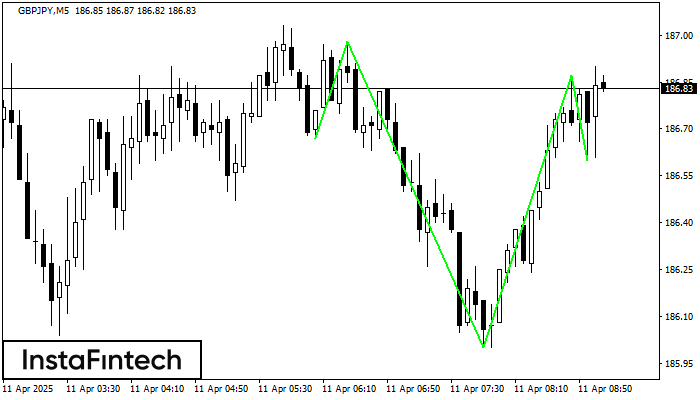
According to the chart of M5, GBPJPY produced the pattern termed the Inverse Head and Shoulder. The Head is fixed at 186.00 while the median line of the Neck
The M5 and M15 time frames may have more false entry points.
Open chart in a new window
Bullish Symmetrical Triangle
was formed on 11.04 at 07:59:53 (UTC+0)
signal strength 1 of 5
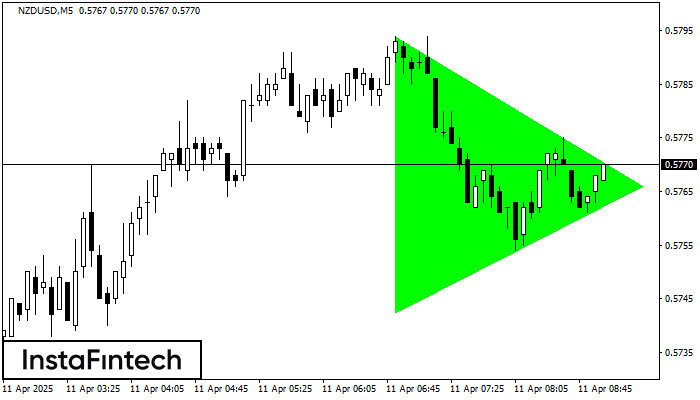
According to the chart of M5, NZDUSD formed the Bullish Symmetrical Triangle pattern. Description: This is the pattern of a trend continuation. 0.5794 and 0.5742 are the coordinates
The M5 and M15 time frames may have more false entry points.
Open chart in a new window


