

Pola sebenarnya

Triple Bottom
was formed on 02.04 at 12:00:59 (UTC+0)
signal strength 4 of 5
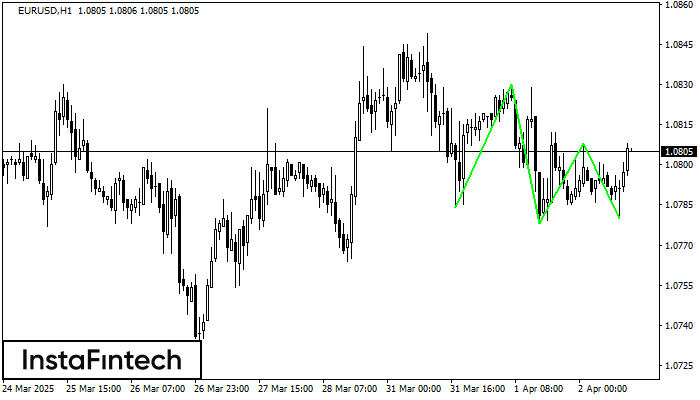
The Triple Bottom pattern has been formed on EURUSD H1. It has the following characteristics: resistance level 1.0830/1.0808; support level 1.0784/1.0780; the width is 46 points. In the event of a breakdown of the resistance level of 1.0830, the price is likely to continue an upward movement at least to 1.0818.
- All
- All
- Bearish Rectangle
- Bearish Symmetrical Triangle
- Bearish Symmetrical Triangle
- Bullish Rectangle
- Double Top
- Double Top
- Triple Bottom
- Triple Bottom
- Triple Top
- Triple Top
- All
- All
- Buy
- Sale
- All
- 1
- 2
- 3
- 4
- 5
Bearish Symmetrical Triangle
was formed on 14.04 at 10:31:57 (UTC+0)
signal strength 1 of 5
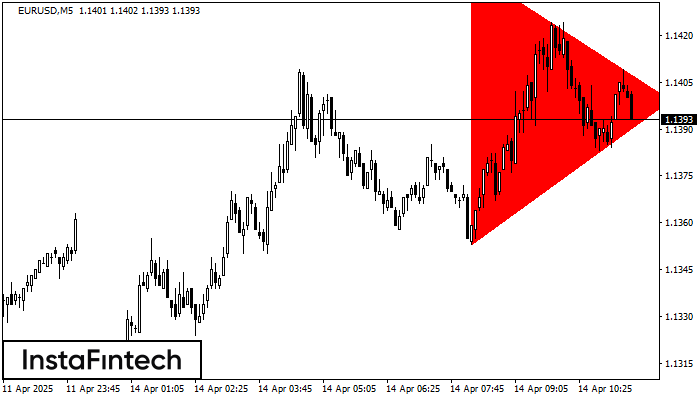
According to the chart of M5, EURUSD formed the Bearish Symmetrical Triangle pattern. Description: The lower border is 1.1353/1.1399 and upper border is 1.1441/1.1399. The pattern width is measured
The M5 and M15 time frames may have more false entry points.
Open chart in a new window
Double Top
was formed on 14.04 at 10:15:57 (UTC+0)
signal strength 1 of 5
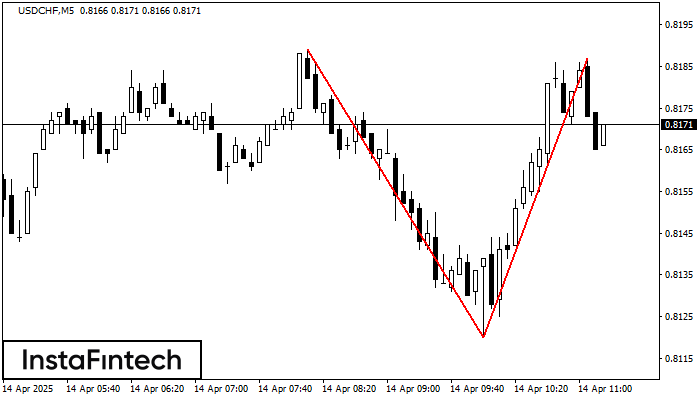
The Double Top reversal pattern has been formed on USDCHF M5. Characteristics: the upper boundary 0.8189; the lower boundary 0.8120; the width of the pattern is 67 points. Sell trades
The M5 and M15 time frames may have more false entry points.
Open chart in a new window
Double Bottom
was formed on 14.04 at 10:00:17 (UTC+0)
signal strength 2 of 5

The Double Bottom pattern has been formed on USDJPY M15. Characteristics: the support level 142.26; the resistance level 143.29; the width of the pattern 103 points. If the resistance level
The M5 and M15 time frames may have more false entry points.
Open chart in a new window


