

Pola sebenarnya

Triple Top
was formed on 31.03 at 10:00:28 (UTC+0)
signal strength 3 of 5

On the chart of the EURUSD M30 trading instrument, the Triple Top pattern that signals a trend change has formed. It is possible that after formation of the third peak, the price will try to break through the resistance level 1.0805, where we advise to open a trading position for sale. Take profit is the projection of the pattern’s width, which is 39 points.
Lihat juga
- All
- All
- Bearish Rectangle
- Bearish Symmetrical Triangle
- Bearish Symmetrical Triangle
- Bullish Rectangle
- Double Top
- Double Top
- Triple Bottom
- Triple Bottom
- Triple Top
- Triple Top
- All
- All
- Buy
- Sale
- All
- 1
- 2
- 3
- 4
- 5
Double Bottom
сформирован 02.04 в 10:15:42 (UTC+0)
сила сигнала 2 из 5
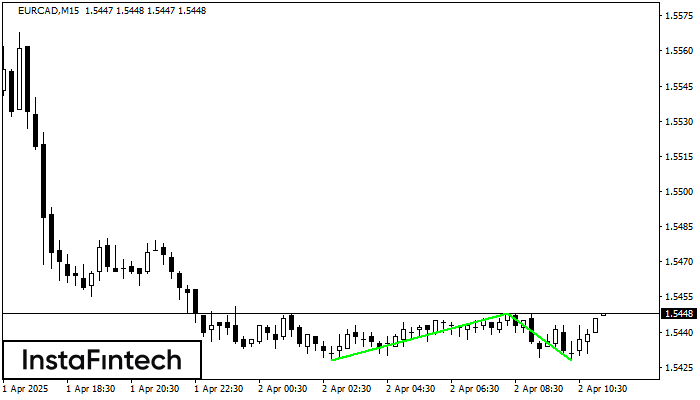
The Double Bottom pattern has been formed on EURCAD M15. This formation signals a reversal of the trend from downwards to upwards. The signal is that a buy trade should
The M5 and M15 time frames may have more false entry points.
Открыть график инструмента в новом окне
Double Top
сформирован 02.04 в 09:30:23 (UTC+0)
сила сигнала 3 из 5
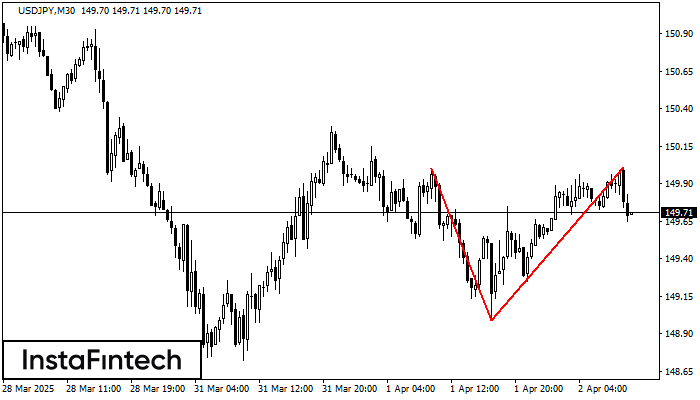
The Double Top reversal pattern has been formed on USDJPY M30. Characteristics: the upper boundary 150.00; the lower boundary 148.99; the width of the pattern is 102 points. Sell trades
Открыть график инструмента в новом окне
Head and Shoulders
сформирован 02.04 в 09:15:29 (UTC+0)
сила сигнала 1 из 5

The NZDJPY M5 formed the Head and Shoulders pattern with the following features: The Head’s top is at 85.95, the Neckline and the upward angle are at 85.69/85.68. The formation
The M5 and M15 time frames may have more false entry points.
Открыть график инструмента в новом окне


