

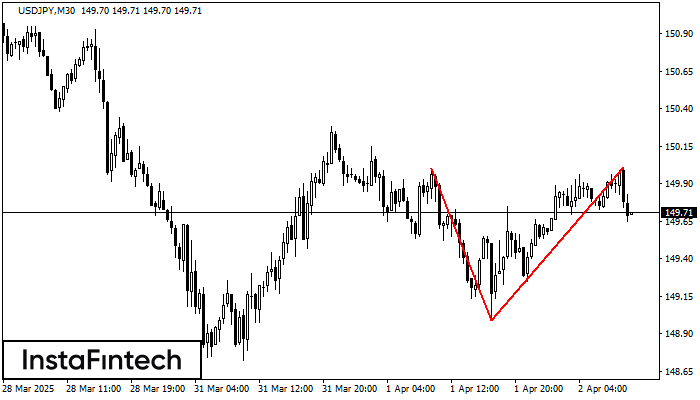
Pola sebenarnya

Double Bottom
was formed on 31.03 at 10:00:26 (UTC+0)
signal strength 3 of 5

The Double Bottom pattern has been formed on USDJPY M30. This formation signals a reversal of the trend from downwards to upwards. The signal is that a buy trade should be opened after the upper boundary of the pattern 149.26 is broken. The further movements will rely on the width of the current pattern 52 points.
Lihat juga
- All
- All
- Bearish Rectangle
- Bearish Symmetrical Triangle
- Bearish Symmetrical Triangle
- Bullish Rectangle
- Double Top
- Double Top
- Triple Bottom
- Triple Bottom
- Triple Top
- Triple Top
- All
- All
- Buy
- Sale
- All
- 1
- 2
- 3
- 4
- 5
Double Bottom
сформирован 02.04 в 10:15:42 (UTC+0)
сила сигнала 2 из 5
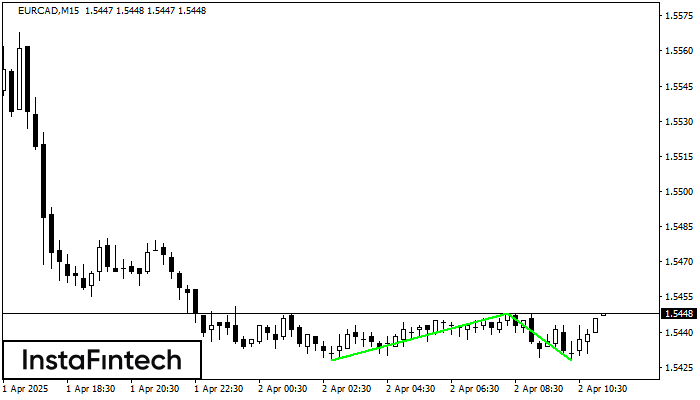
The Double Bottom pattern has been formed on EURCAD M15. This formation signals a reversal of the trend from downwards to upwards. The signal is that a buy trade should
The M5 and M15 time frames may have more false entry points.
Открыть график инструмента в новом окне
Double Top
сформирован 02.04 в 09:30:23 (UTC+0)
сила сигнала 3 из 5
The Double Top reversal pattern has been formed on USDJPY M30. Characteristics: the upper boundary 150.00; the lower boundary 148.99; the width of the pattern is 102 points. Sell trades
Открыть график инструмента в новом окне
Head and Shoulders
сформирован 02.04 в 09:15:29 (UTC+0)
сила сигнала 1 из 5

The NZDJPY M5 formed the Head and Shoulders pattern with the following features: The Head’s top is at 85.95, the Neckline and the upward angle are at 85.69/85.68. The formation
The M5 and M15 time frames may have more false entry points.
Открыть график инструмента в новом окне


