

Pola sebenarnya

Double Top
was formed on 28.03 at 10:10:18 (UTC+0)
signal strength 1 of 5
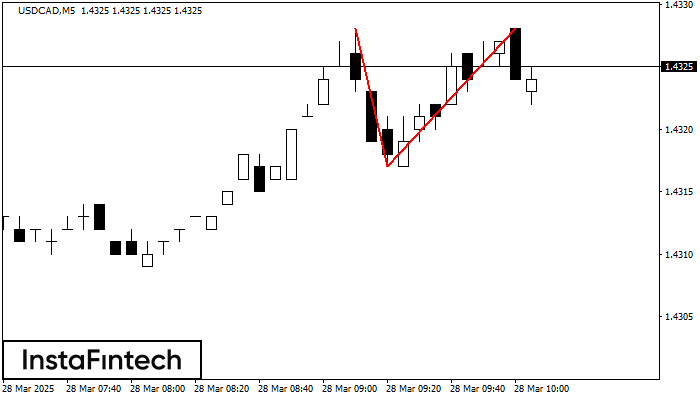
The Double Top reversal pattern has been formed on USDCAD M5. Characteristics: the upper boundary 1.4328; the lower boundary 1.4317; the width of the pattern is 11 points. Sell trades are better to be opened below the lower boundary 1.4317 with a possible movements towards the 1.4302 level.
The M5 and M15 time frames may have more false entry points.
- All
- All
- Bearish Rectangle
- Bearish Symmetrical Triangle
- Bearish Symmetrical Triangle
- Bullish Rectangle
- Double Top
- Double Top
- Triple Bottom
- Triple Bottom
- Triple Top
- Triple Top
- All
- All
- Buy
- Sale
- All
- 1
- 2
- 3
- 4
- 5
Triple Top
was formed on 31.03 at 20:05:23 (UTC+0)
signal strength 1 of 5
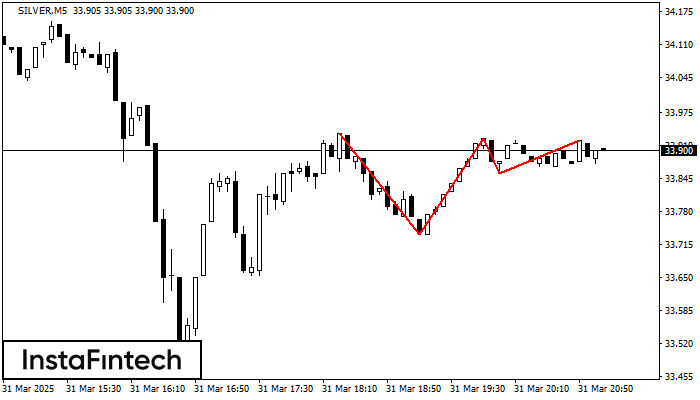
The Triple Top pattern has formed on the chart of the SILVER M5 trading instrument. It is a reversal pattern featuring the following characteristics: resistance level 15, support level -120
The M5 and M15 time frames may have more false entry points.
Open chart in a new window
Triple Top
was formed on 31.03 at 19:45:55 (UTC+0)
signal strength 1 of 5
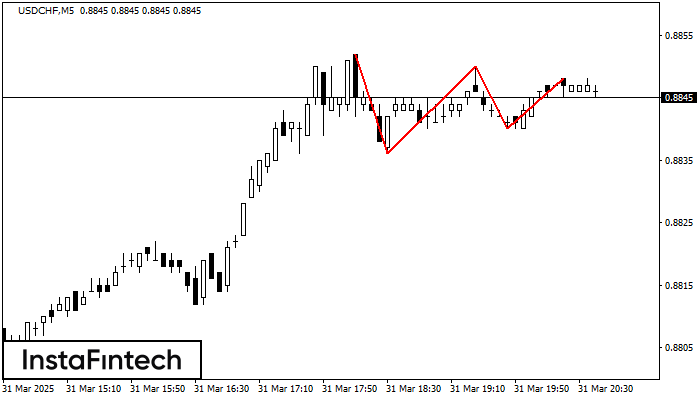
The Triple Top pattern has formed on the chart of the USDCHF M5 trading instrument. It is a reversal pattern featuring the following characteristics: resistance level 4, support level -4
The M5 and M15 time frames may have more false entry points.
Open chart in a new window
Bullish Rectangle
was formed on 31.03 at 19:02:59 (UTC+0)
signal strength 1 of 5
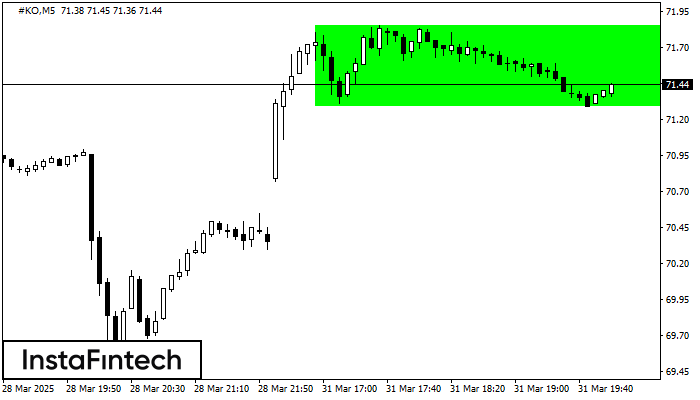
According to the chart of M5, #KO formed the Bullish Rectangle. The pattern indicates a trend continuation. The upper border is 71.85, the lower border is 71.29. The signal means
The M5 and M15 time frames may have more false entry points.
Open chart in a new window

