

Pola sebenarnya

Triple Bottom
was formed on 28.03 at 01:45:48 (UTC+0)
signal strength 2 of 5
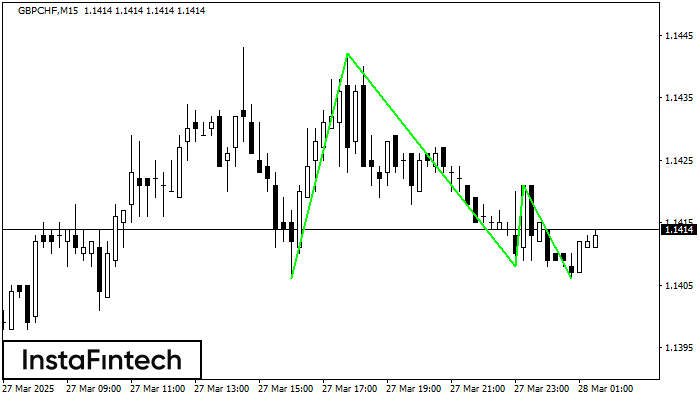
The Triple Bottom pattern has formed on the chart of GBPCHF M15. Features of the pattern: The lower line of the pattern has coordinates 1.1442 with the upper limit 1.1442/1.1421, the projection of the width is 36 points. The formation of the Triple Bottom pattern most likely indicates a change in the trend from downward to upward. This means that in the event of a breakdown of the resistance level 1.1406, the price is most likely to continue the upward movement.
The M5 and M15 time frames may have more false entry points.
Lihat juga
- All
- All
- Bearish Rectangle
- Bearish Symmetrical Triangle
- Bearish Symmetrical Triangle
- Bullish Rectangle
- Double Top
- Double Top
- Triple Bottom
- Triple Bottom
- Triple Top
- Triple Top
- All
- All
- Buy
- Sale
- All
- 1
- 2
- 3
- 4
- 5
Persegi Bullish
was formed on 17.04 at 21:47:00 (UTC+0)
signal strength 2 of 5
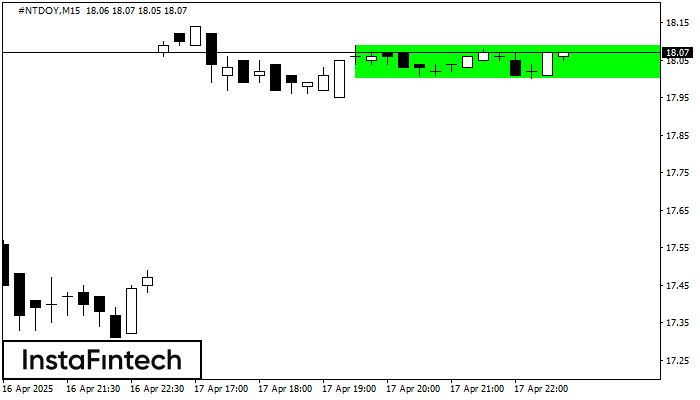
Menurut grafik dari M15, #NTDOY terbentuk Persegi Bullish. Pola menunjukkan kelanjutan tren. Batas atas adalah 18.09, batas lebih rendah adalah 18.00. Sinyal berarti posisi beli harus dibuka diatas batas atas
Rangka waktu M5 dan M15 mungkin memiliki lebih dari titik entri yang keliru.
Open chart in a new window
Persegi Bullish
was formed on 17.04 at 21:45:00 (UTC+0)
signal strength 1 of 5
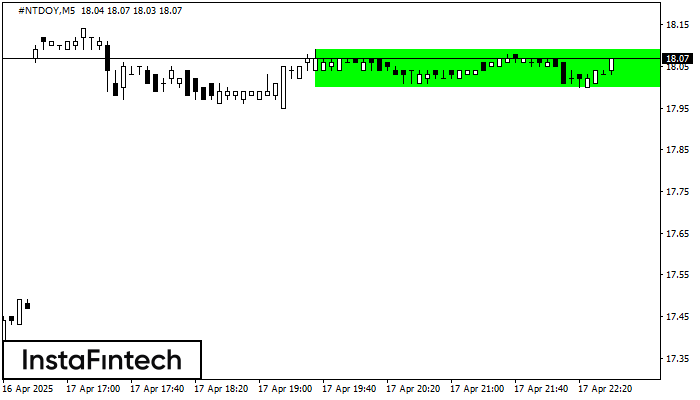
Menurut grafik dari M5, #NTDOY terbentuk Persegi Bullish. Pola menunjukkan kelanjutan tren. Batas atas adalah 18.09, batas lebih rendah adalah 18.00. Sinyal berarti posisi beli harus dibuka diatas batas atas
Rangka waktu M5 dan M15 mungkin memiliki lebih dari titik entri yang keliru.
Open chart in a new window
Segitiga Simetris Bearish
was formed on 17.04 at 21:00:18 (UTC+0)
signal strength 2 of 5
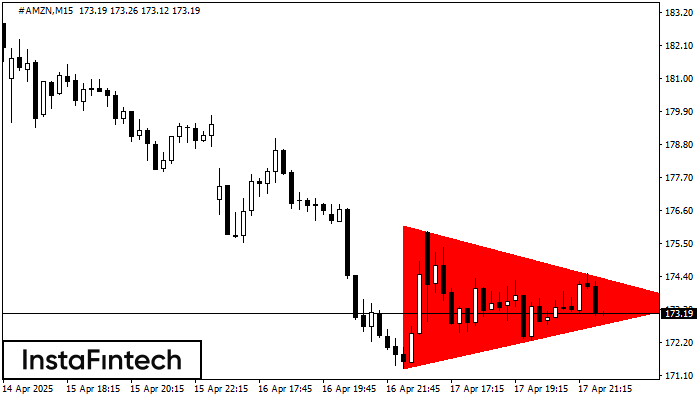
Menurut Grafik dari M15, #AMZN dibentuk pola Segitiga Simetris Bearish. Rekomendasi Trading: Penembusan dari batas yang lebih rendah 171.36 kemungkinan akan mendorong kelanjutan dari tren penurunan
Rangka waktu M5 dan M15 mungkin memiliki lebih dari titik entri yang keliru.
Open chart in a new window


