

Pola sebenarnya

Bullish Rectangle
was formed on 27.03 at 08:06:38 (UTC+0)
signal strength 1 of 5
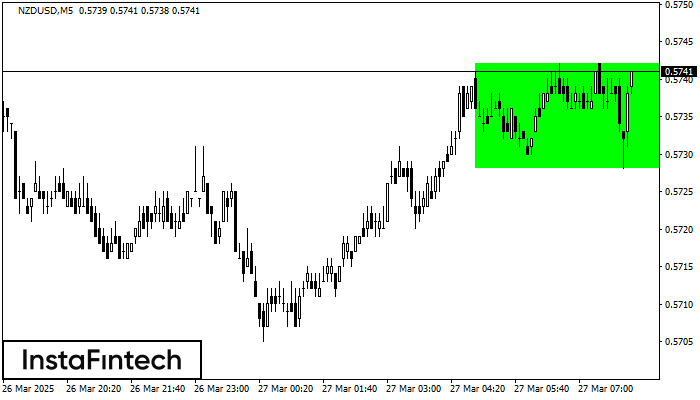
According to the chart of M5, NZDUSD formed the Bullish Rectangle which is a pattern of a trend continuation. The pattern is contained within the following borders: the lower border 0.5728 – 0.5728 and upper border 0.5742 – 0.5742. In case the upper border is broken, the instrument is likely to follow the upward trend.
The M5 and M15 time frames may have more false entry points.
Lihat juga
- All
- All
- Bearish Rectangle
- Bearish Symmetrical Triangle
- Bearish Symmetrical Triangle
- Bullish Rectangle
- Double Top
- Double Top
- Triple Bottom
- Triple Bottom
- Triple Top
- Triple Top
- All
- All
- Buy
- Sale
- All
- 1
- 2
- 3
- 4
- 5
बियरिश पताका
was formed on 30.03 at 23:26:32 (UTC+0)
signal strength 1 of 5

बियरिश पताका पैटर्न AUDCHF M5 चार्ट पर बना है। यदि पताका का 0.5526 निम्न स्तर टूट जाता है, तो पैटर्न डाउनट्रेंड के जारी रहने का संकेत देता है। अनुशंसाएं: पैटर्न
M5 और M15 समय सीमा में अधिक फाल्स एंट्री पॉइंट्स हो सकते हैं।
Open chart in a new window
डबल टॉप
was formed on 30.03 at 23:15:27 (UTC+0)
signal strength 2 of 5
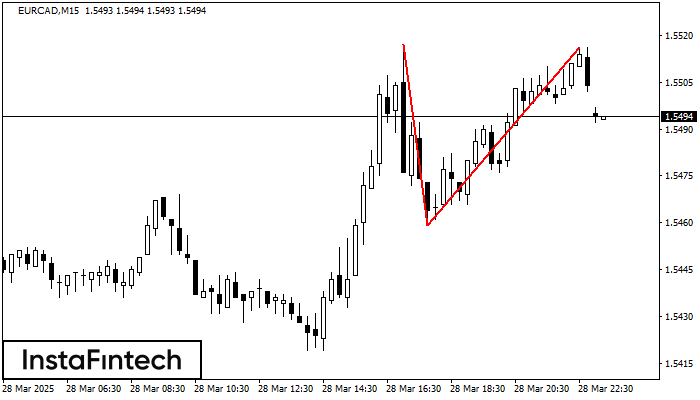
डबल टॉप पैटर्न EURCAD M15 पर बना है। यह संकेत देता है कि प्रवृत्ति ऊपर से नीचे की ओर बदल गई है। संभवतः, यदि 1.5459 पैटर्न का आधार टूट जाता
M5 और M15 समय सीमा में अधिक फाल्स एंट्री पॉइंट्स हो सकते हैं।
Open chart in a new window
डबल बॉटम
was formed on 30.03 at 23:00:32 (UTC+0)
signal strength 2 of 5
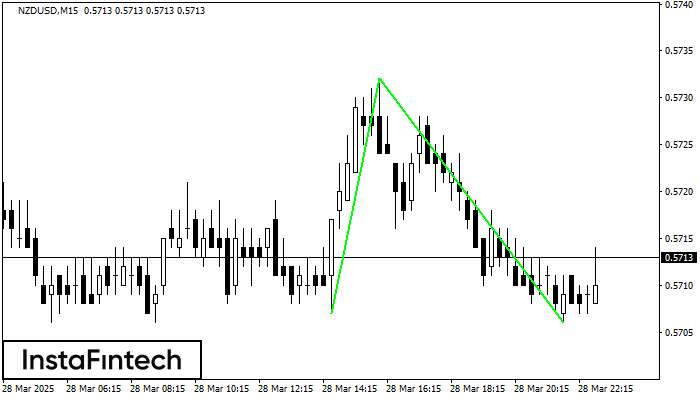
डबल बॉटम पैटर्न NZDUSD M15 पर बना है; ऊपरी सीमा 0.5732 है; निचली सीमा 0.5706 है। पैटर्न की चौड़ाई 25 अंक है। ऊपरी सीमा 0.5732 के टूटने के मामले में
M5 और M15 समय सीमा में अधिक फाल्स एंट्री पॉइंट्स हो सकते हैं।
Open chart in a new window


