

Pola sebenarnya

Double Bottom
was formed on 25.03 at 13:01:07 (UTC+0)
signal strength 4 of 5
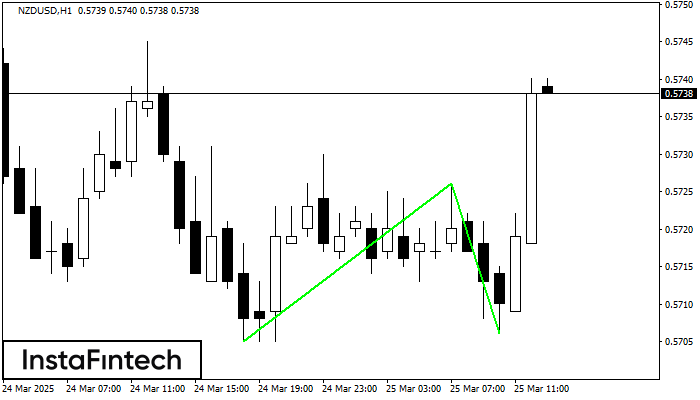
The Double Bottom pattern has been formed on NZDUSD H1. Characteristics: the support level 0.5705; the resistance level 0.5726; the width of the pattern 21 points. If the resistance level is broken, a change in the trend can be predicted with the first target point lying at the distance of 20 points.
Lihat juga
- All
- All
- Bearish Rectangle
- Bearish Symmetrical Triangle
- Bearish Symmetrical Triangle
- Bullish Rectangle
- Double Top
- Double Top
- Triple Bottom
- Triple Bottom
- Triple Top
- Triple Top
- All
- All
- Buy
- Sale
- All
- 1
- 2
- 3
- 4
- 5
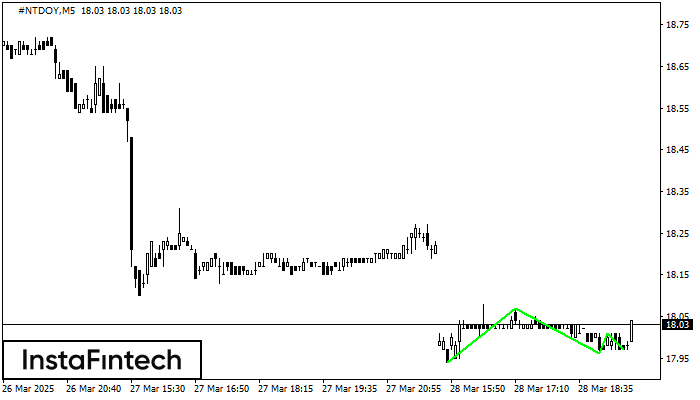
Bawah Triple
was formed on 28.03 at 19:46:37 (UTC+0)
signal strength 1 of 5

Pola Bawah Triple telah terbentuk pada grafik instrumen trading #NTDOY M5. Pola tersebut menandakan perubahan dalam trend dari menurun menjadi naik jika terjadi pemecahan (breakdown) 18.07/18.01
Rangka waktu M5 dan M15 mungkin memiliki lebih dari titik entri yang keliru.
Open chart in a new window
Bawah Triple
was formed on 28.03 at 19:46:29 (UTC+0)
signal strength 1 of 5
Pola Bawah Triple telah terbentuk pada grafik instrumen trading #NTDOY M5. Pola tersebut menandakan perubahan dalam trend dari menurun menjadi naik jika terjadi pemecahan (breakdown) 18.07/18.01
Rangka waktu M5 dan M15 mungkin memiliki lebih dari titik entri yang keliru.
Open chart in a new window
Segitiga Simetris Bearish
was formed on 28.03 at 19:23:04 (UTC+0)
signal strength 4 of 5
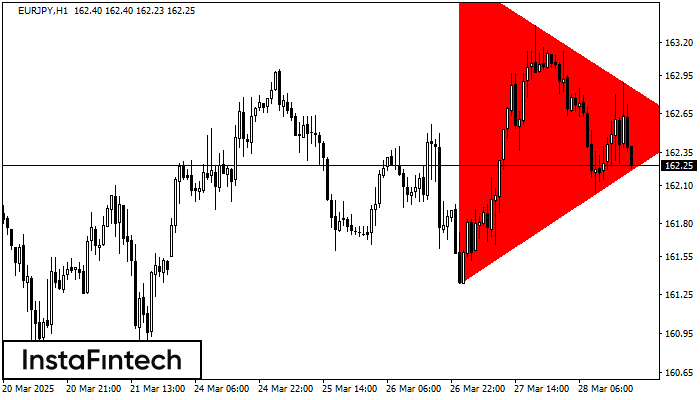
Menurut Grafik dari H1, EURJPY dibentuk pola Segitiga Simetris Bearish. Pola ini mengisyaratkan tren penurunan lebih lanjut jika terdapat batas yang lebih rendah 161.34 ditembus. Disini, sebuah keuntungan hipotetis akan
Open chart in a new window


