

Pola sebenarnya

Bearish Rectangle
was formed on 21.03 at 21:46:26 (UTC+0)
signal strength 1 of 5

According to the chart of M5, USDCAD formed the Bearish Rectangle which is a pattern of a trend continuation. The pattern is contained within the following borders: lower border 1.4338 – 1.4338 and upper border 1.4351 – 1.4351. In case the lower border is broken, the instrument is likely to follow the downward trend.
The M5 and M15 time frames may have more false entry points.
Lihat juga
- All
- All
- Bearish Rectangle
- Bearish Symmetrical Triangle
- Bearish Symmetrical Triangle
- Bullish Rectangle
- Double Top
- Double Top
- Triple Bottom
- Triple Bottom
- Triple Top
- Triple Top
- All
- All
- Buy
- Sale
- All
- 1
- 2
- 3
- 4
- 5
Kepala dan bahu
was formed on 25.03 at 04:15:36 (UTC+0)
signal strength 1 of 5

Menurut grafik M5, USDJPY membentuk pola Kepala dan bahu. Puncak The Head ditetapkan di 150.87 sementara garis median the Neck ditemukan di 150.68/150.70. Formasi pola Kepala dan bahu terbukti mensinyalkan
Rangka waktu M5 dan M15 mungkin memiliki lebih dari titik entri yang keliru.
Open chart in a new window
Teratas Ganda
was formed on 25.03 at 04:00:34 (UTC+0)
signal strength 2 of 5
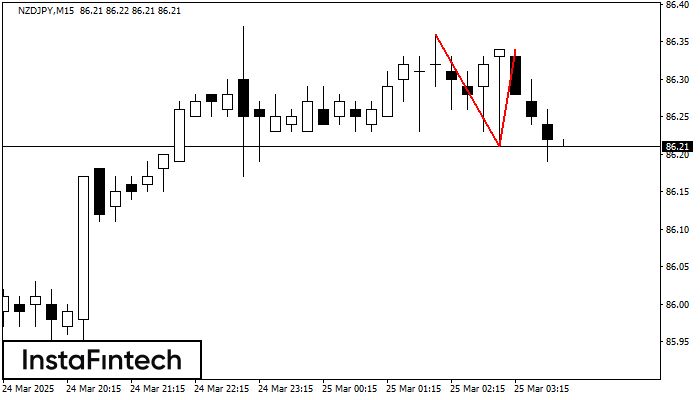
Pada grafik NZDJPY M15 pola reversal Teratas Ganda telah terbentuk. Karakteristik: batas atas 86.34; batas bawah 86.21; lebar pola 13 poin. Sinyal: tembusan ke batas bawah akan menyebabkan kelanjutan tren
Rangka waktu M5 dan M15 mungkin memiliki lebih dari titik entri yang keliru.
Open chart in a new window
Teratas Triple
was formed on 25.03 at 03:55:23 (UTC+0)
signal strength 1 of 5
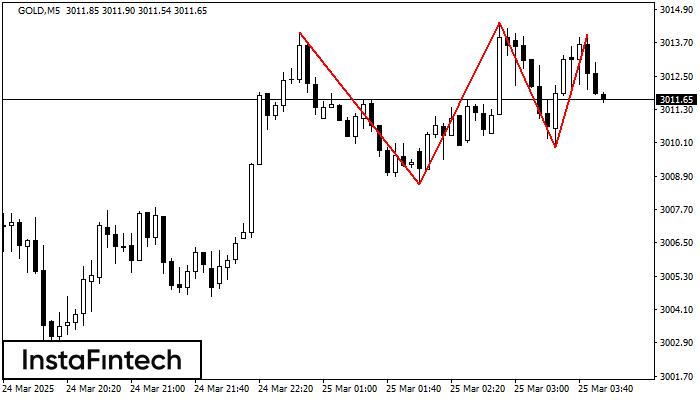
Pada grafik instrumen trading GOLD M5, pola Teratas Triple yang menandakan perubahan trend telah terbentuk. Ada kemungkinan bahwa setelah pembentukan puncak (peak) ketiga, harga akan mencoba untuk menembus level resistance
Rangka waktu M5 dan M15 mungkin memiliki lebih dari titik entri yang keliru.
Open chart in a new window


