Pola sebenarnya

Inverse Head and Shoulder
was formed on 21.03 at 19:50:04 (UTC+0)
signal strength 1 of 5
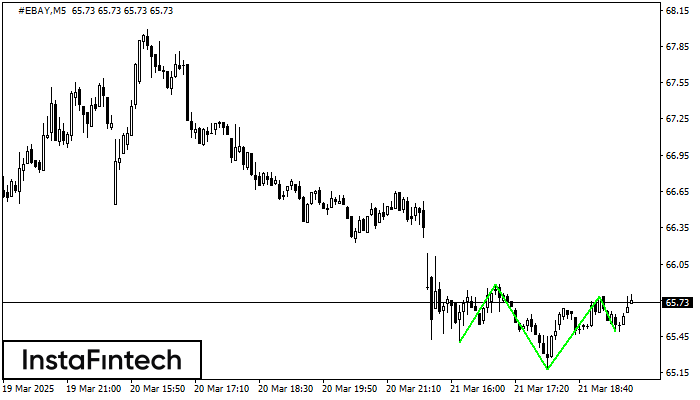
According to the chart of M5, #EBAY formed the Inverse Head and Shoulder pattern. The Head’s top is set at 65.78 while the median line of the Neck is found at 65.18/65.49. The formation of the Inverse Head and Shoulder pattern evidently signals a reversal of the downward trend. In other words, in case the scenario comes true, the price of #EBAY will go towards 65.93
The M5 and M15 time frames may have more false entry points.
Lihat juga
- All
- All
- Bearish Rectangle
- Bearish Symmetrical Triangle
- Bearish Symmetrical Triangle
- Bullish Rectangle
- Double Top
- Double Top
- Triple Bottom
- Triple Bottom
- Triple Top
- Triple Top
- All
- All
- Buy
- Sale
- All
- 1
- 2
- 3
- 4
- 5
Double Bottom
was formed on 25.03 at 02:55:11 (UTC+0)
signal strength 1 of 5
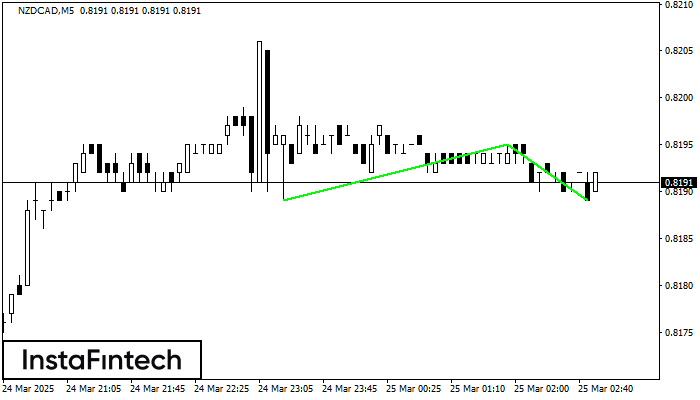
The Double Bottom pattern has been formed on NZDCAD M5; the upper boundary is 0.8195; the lower boundary is 0.8189. The width of the pattern is 6 points. In case
The M5 and M15 time frames may have more false entry points.
Open chart in a new window
Bearish Symmetrical Triangle
was formed on 25.03 at 02:15:36 (UTC+0)
signal strength 2 of 5

According to the chart of M15, EURUSD formed the Bearish Symmetrical Triangle pattern. Description: The lower border is 1.0781/1.0799 and upper border is 1.0818/1.0799. The pattern width is measured
The M5 and M15 time frames may have more false entry points.
Open chart in a new window
Triple Bottom
was formed on 25.03 at 02:00:36 (UTC+0)
signal strength 3 of 5
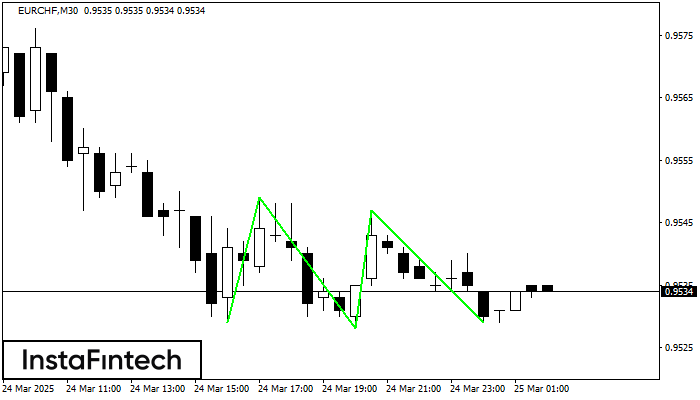
The Triple Bottom pattern has formed on the chart of the EURCHF M30 trading instrument. The pattern signals a change in the trend from downwards to upwards in the case
Open chart in a new window