

Pola sebenarnya

Bullish Symmetrical Triangle
was formed on 21.03 at 19:35:14 (UTC+0)
signal strength 1 of 5
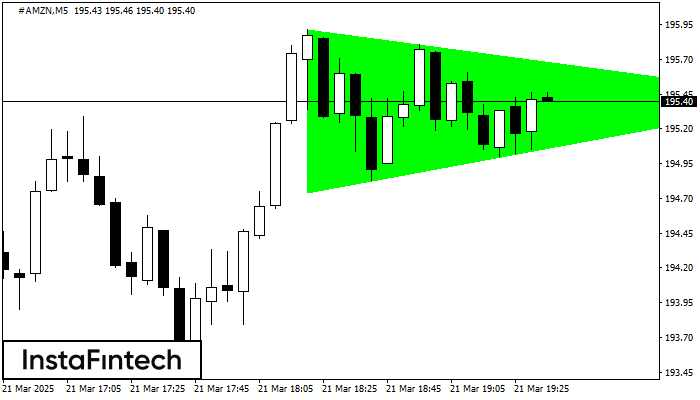
According to the chart of M5, #AMZN formed the Bullish Symmetrical Triangle pattern. The lower border of the pattern touches the coordinates 194.75/195.42 whereas the upper border goes across 195.92/195.42. If the Bullish Symmetrical Triangle pattern is in progress, this evidently signals a further upward trend. In other words, in case the scenario comes true, the price of #AMZN will breach the upper border to head for 195.57.
The M5 and M15 time frames may have more false entry points.
Lihat juga
- All
- All
- Bearish Rectangle
- Bearish Symmetrical Triangle
- Bearish Symmetrical Triangle
- Bullish Rectangle
- Double Top
- Double Top
- Triple Bottom
- Triple Bottom
- Triple Top
- Triple Top
- All
- All
- Buy
- Sale
- All
- 1
- 2
- 3
- 4
- 5
Bawah Ganda
was formed on 25.03 at 02:55:11 (UTC+0)
signal strength 1 of 5
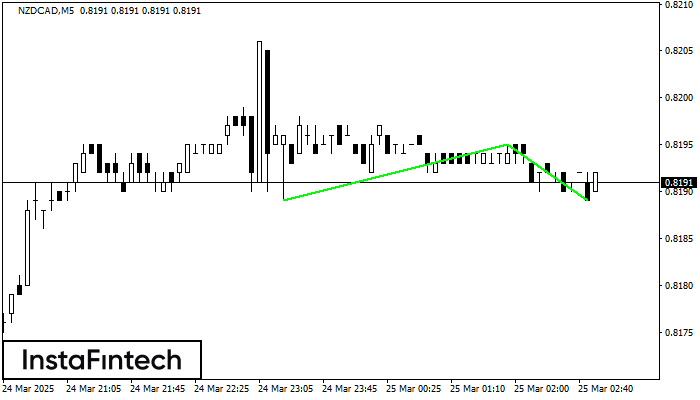
Pola Bawah Ganda telah terbentuk pada NZDCAD M5; batas atas di 0.8195; batas bawah di 0.8189. Lebar pola sebesar 6 poin. Jika harga menembus batas atas 0.8195, Perubahan dalam tren
Rangka waktu M5 dan M15 mungkin memiliki lebih dari titik entri yang keliru.
Open chart in a new window
Segitiga Simetris Bearish
was formed on 25.03 at 02:15:36 (UTC+0)
signal strength 2 of 5

Menurut Grafik dari M15, EURUSD dibentuk pola Segitiga Simetris Bearish. Deskripsi: Batas yang lebih rendah adalah 1.0781/1.0799 dan batas atas adalah 1.0818/1.0799. Lebar pola diukur dalam grafik di -37 pips
Rangka waktu M5 dan M15 mungkin memiliki lebih dari titik entri yang keliru.
Open chart in a new window
Bawah Triple
was formed on 25.03 at 02:00:36 (UTC+0)
signal strength 3 of 5
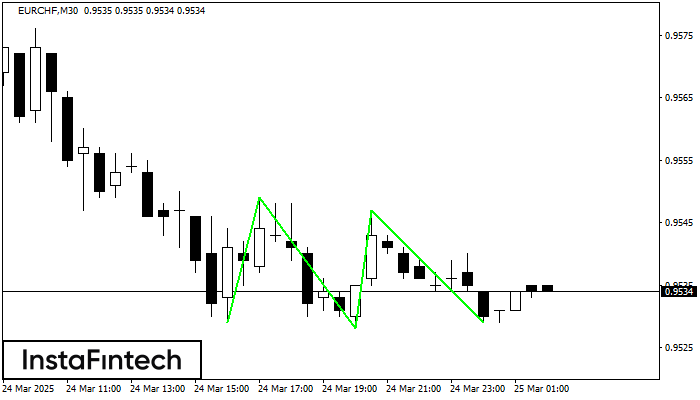
Pola Bawah Triple telah terbentuk pada grafik instrumen trading EURCHF M30. Pola tersebut menandakan perubahan dalam trend dari menurun menjadi naik jika terjadi pemecahan (breakdown) 0.9549/0.9547
Open chart in a new window


