

Pola sebenarnya

Bullish Flag
was formed on 21.03 at 19:22:58 (UTC+0)
signal strength 1 of 5
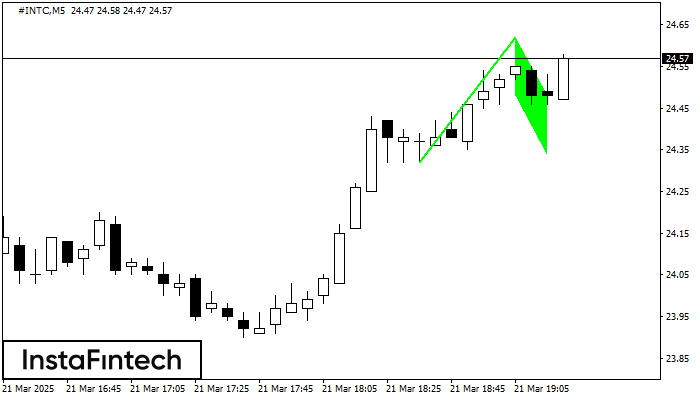
The Bullish Flag pattern has been formed on the chart #INTC M5 which signals that the upward trend will continue. Signals: а break of the peak at 24.62 may push the price higher, and the rise will be the projection of the pole.
The M5 and M15 time frames may have more false entry points.
Lihat juga
- All
- All
- Bearish Rectangle
- Bearish Symmetrical Triangle
- Bearish Symmetrical Triangle
- Bullish Rectangle
- Double Top
- Double Top
- Triple Bottom
- Triple Bottom
- Triple Top
- Triple Top
- All
- All
- Buy
- Sale
- All
- 1
- 2
- 3
- 4
- 5
Bearish Rectangle
was formed on 24.03 at 21:46:19 (UTC+0)
signal strength 2 of 5
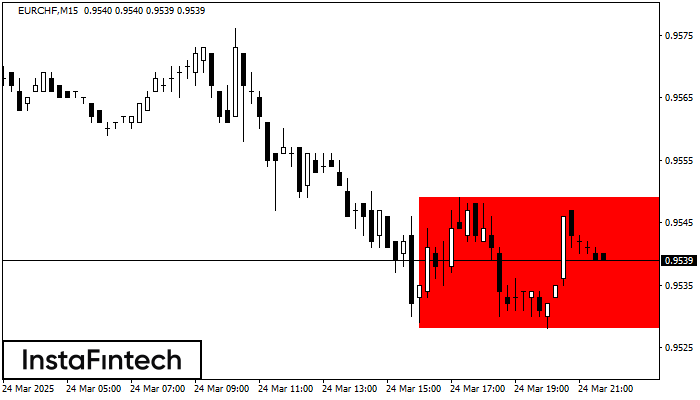
According to the chart of M15, EURCHF formed the Bearish Rectangle which is a pattern of a trend continuation. The pattern is contained within the following borders: lower border 0.9528
The M5 and M15 time frames may have more false entry points.
Open chart in a new window
Bullish pennant
was formed on 24.03 at 21:30:30 (UTC+0)
signal strength 4 of 5
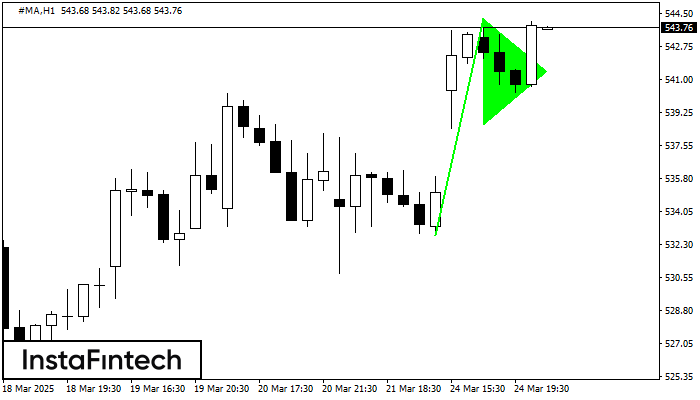
The Bullish pennant pattern is formed on the #MA H1 chart. It is a type of the continuation pattern. Supposedly, in case the price is fixed above the pennant’s high
Open chart in a new window
Double Bottom
was formed on 24.03 at 21:01:22 (UTC+0)
signal strength 3 of 5
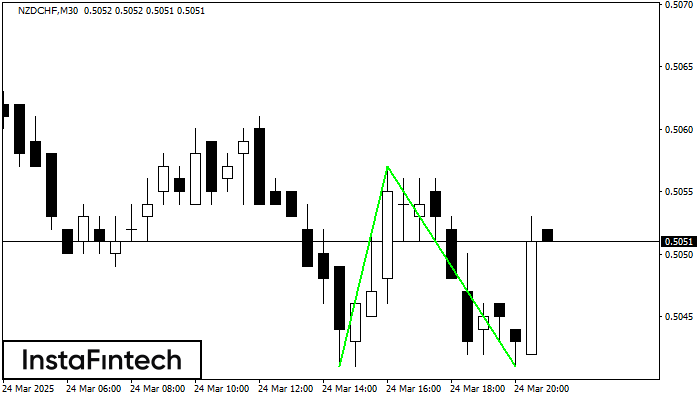
The Double Bottom pattern has been formed on NZDCHF M30. This formation signals a reversal of the trend from downwards to upwards. The signal is that a buy trade should
Open chart in a new window


