

Pola sebenarnya

Bullish Symmetrical Triangle
was formed on 21.03 at 02:01:15 (UTC+0)
signal strength 2 of 5
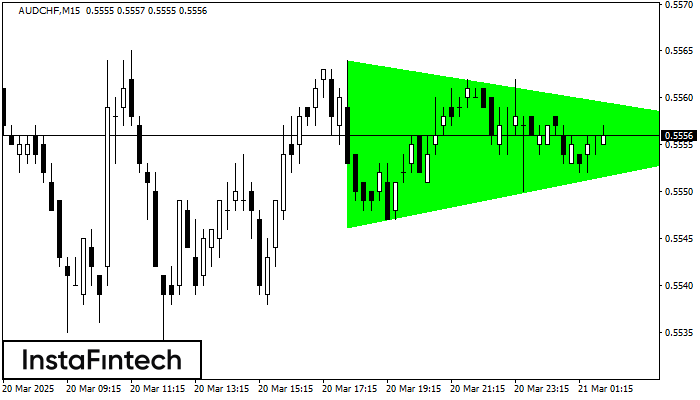
According to the chart of M15, AUDCHF formed the Bullish Symmetrical Triangle pattern, which signals the trend will continue. Description. The upper border of the pattern touches the coordinates 0.5564/0.5556 whereas the lower border goes across 0.5546/0.5556. The pattern width is measured on the chart at 18 pips. If the Bullish Symmetrical Triangle pattern is in progress during the upward trend, this indicates the current trend will go on. In case 0.5556 is broken, the price could continue its move toward 0.5579.
The M5 and M15 time frames may have more false entry points.
Lihat juga
- All
- All
- Bearish Rectangle
- Bearish Symmetrical Triangle
- Bearish Symmetrical Triangle
- Bullish Rectangle
- Double Top
- Double Top
- Triple Bottom
- Triple Bottom
- Triple Top
- Triple Top
- All
- All
- Buy
- Sale
- All
- 1
- 2
- 3
- 4
- 5
Kepala dan Bahu Terbalik
was formed on 28.03 at 11:39:48 (UTC+0)
signal strength 1 of 5
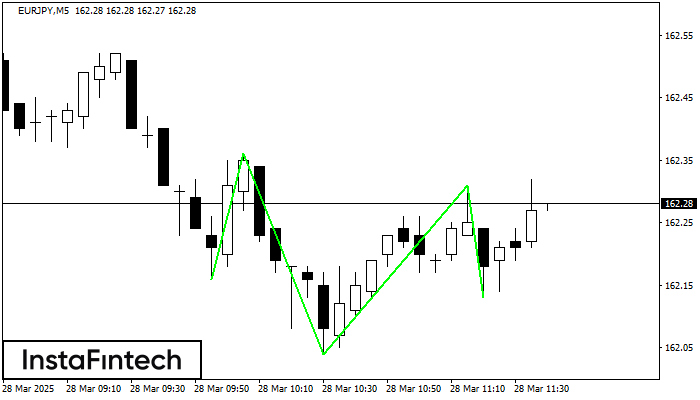
Menurut M5, EURJPY membentuk pola teknikal – Kepala dan Bahu Terbalik. Jika garis leher (Neckline) 162.36/162.31 ditembus, maka instrumen ini kemungkinan akan bergerak menuju 162.46
Rangka waktu M5 dan M15 mungkin memiliki lebih dari titik entri yang keliru.
Open chart in a new window
Teratas Ganda
was formed on 28.03 at 11:04:46 (UTC+0)
signal strength 1 of 5
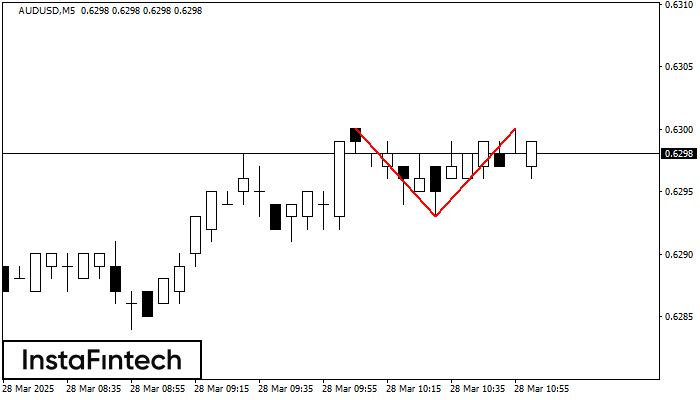
Pola Teratas Ganda telah terbentuk pada AUDUSD M5. Pola ini menandakan bahwa tren telah berubah dari kenaikan menjadi penurunan. Mungkin, jika dasar pola di 0.6293 ditembus, maka pergerakan menurun akan
Rangka waktu M5 dan M15 mungkin memiliki lebih dari titik entri yang keliru.
Open chart in a new window
Teratas Ganda
was formed on 28.03 at 10:30:00 (UTC+0)
signal strength 3 of 5
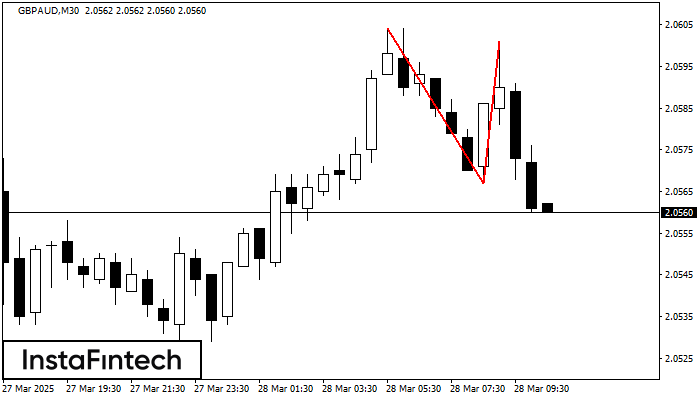
Pada grafik GBPAUD M30 pola reversal Teratas Ganda telah terbentuk. Karakteristik: batas atas 2.0601; batas bawah 2.0567; lebar pola 34 poin. Sinyal: tembusan ke batas bawah akan menyebabkan kelanjutan tren
Open chart in a new window


