

Pola sebenarnya

Triple Top
was formed on 21.03 at 01:30:16 (UTC+0)
signal strength 2 of 5
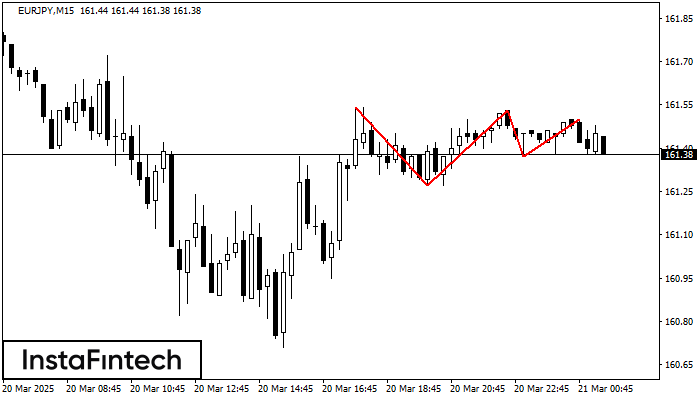
On the chart of the EURJPY M15 trading instrument, the Triple Top pattern that signals a trend change has formed. It is possible that after formation of the third peak, the price will try to break through the resistance level 161.27, where we advise to open a trading position for sale. Take profit is the projection of the pattern’s width, which is 27 points.
The M5 and M15 time frames may have more false entry points.
- All
- All
- Bearish Rectangle
- Bearish Symmetrical Triangle
- Bearish Symmetrical Triangle
- Bullish Rectangle
- Double Top
- Double Top
- Triple Bottom
- Triple Bottom
- Triple Top
- Triple Top
- All
- All
- Buy
- Sale
- All
- 1
- 2
- 3
- 4
- 5
Bullish Rectangle
was formed on 25.03 at 01:16:00 (UTC+0)
signal strength 2 of 5
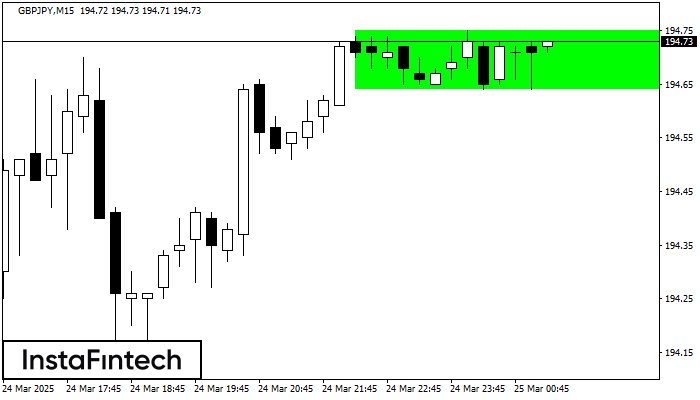
According to the chart of M15, GBPJPY formed the Bullish Rectangle. This type of a pattern indicates a trend continuation. It consists of two levels: resistance 194.75 and support 194.64
The M5 and M15 time frames may have more false entry points.
Open chart in a new window
Double Top
was formed on 25.03 at 01:00:30 (UTC+0)
signal strength 3 of 5
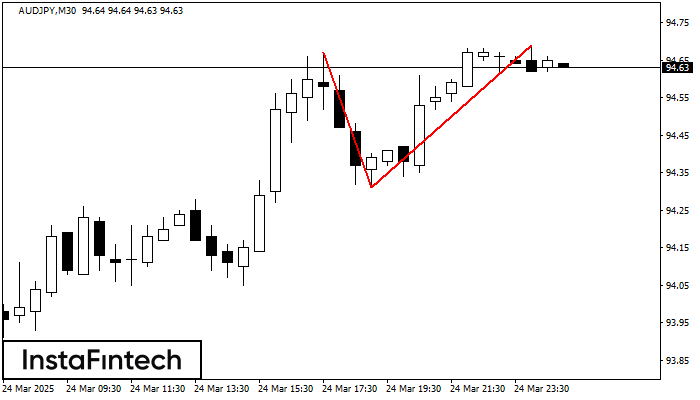
On the chart of AUDJPY M30 the Double Top reversal pattern has been formed. Characteristics: the upper boundary 94.69; the lower boundary 94.31; the width of the pattern 38 points
Open chart in a new window
Bullish Rectangle
was formed on 25.03 at 00:41:00 (UTC+0)
signal strength 1 of 5
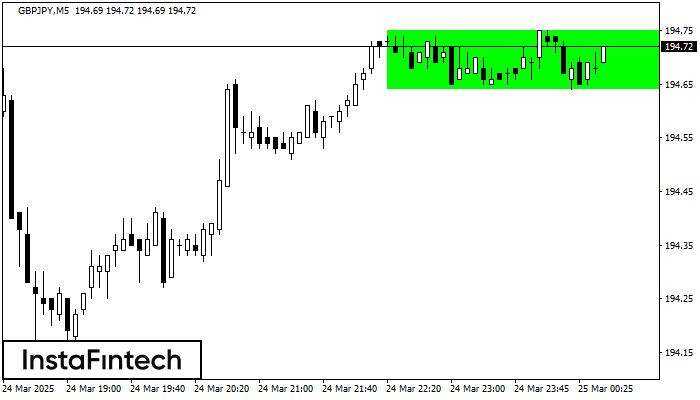
According to the chart of M5, GBPJPY formed the Bullish Rectangle. This type of a pattern indicates a trend continuation. It consists of two levels: resistance 194.75 and support 194.64
The M5 and M15 time frames may have more false entry points.
Open chart in a new window


