

Pola sebenarnya

Head and Shoulders
was formed on 20.03 at 20:30:27 (UTC+0)
signal strength 1 of 5
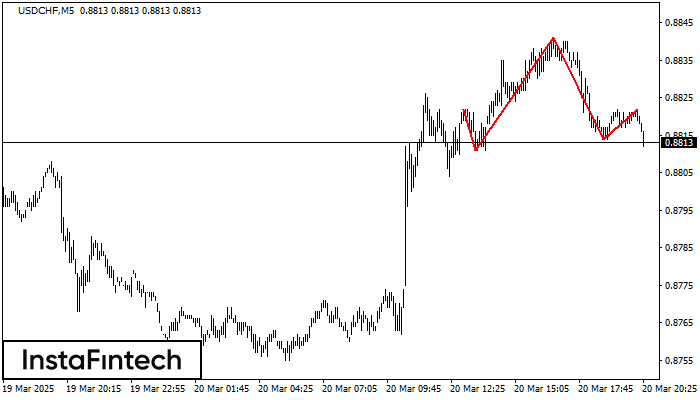
The USDCHF M5 formed the Head and Shoulders pattern with the following features: The Head’s top is at 0.8841, the Neckline and the upward angle are at 0.8811/0.8814. The formation of this pattern can bring about changes in the current trend from bullish to bearish. In case the pattern triggers the expected changes, the price of USDCHF will go towards 0.8799.
The M5 and M15 time frames may have more false entry points.
Lihat juga
- All
- All
- Bearish Rectangle
- Bearish Symmetrical Triangle
- Bearish Symmetrical Triangle
- Bullish Rectangle
- Double Top
- Double Top
- Triple Bottom
- Triple Bottom
- Triple Top
- Triple Top
- All
- All
- Buy
- Sale
- All
- 1
- 2
- 3
- 4
- 5
Teratas Ganda
was formed on 25.03 at 10:35:55 (UTC+0)
signal strength 1 of 5
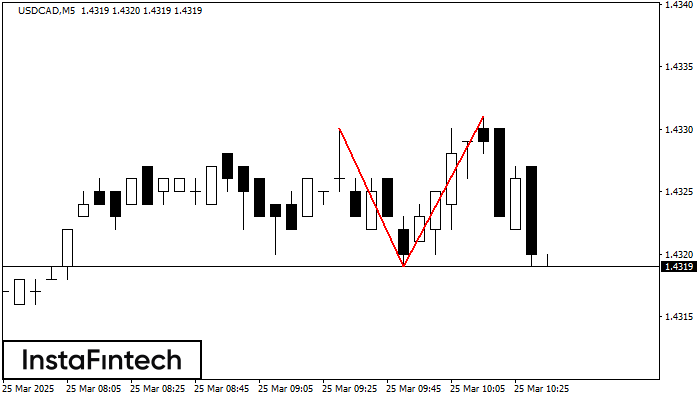
Pada grafik USDCAD M5 pola reversal Teratas Ganda telah terbentuk. Karakteristik: batas atas 1.4331; batas bawah 1.4319; lebar pola 12 poin. Sinyal: tembusan ke batas bawah akan menyebabkan kelanjutan tren
Rangka waktu M5 dan M15 mungkin memiliki lebih dari titik entri yang keliru.
Open chart in a new window
Segitiga Simetris Bearish
was formed on 25.03 at 09:01:43 (UTC+0)
signal strength 2 of 5

Menurut Grafik dari M15, NZDCAD dibentuk pola Segitiga Simetris Bearish. Pola ini mengisyaratkan tren penurunan lebih lanjut jika terdapat batas yang lebih rendah 0.8172 ditembus. Disini, sebuah keuntungan hipotetis akan
Rangka waktu M5 dan M15 mungkin memiliki lebih dari titik entri yang keliru.
Open chart in a new window
Segitiga Simetris Bullish
was formed on 25.03 at 07:05:25 (UTC+0)
signal strength 1 of 5

Menurut Grafik dari M5, AUDUSD dibentuk pola Segitiga Simetris Bullish, yang menunjukkan tren akan berlanjut. Deksripsi. Batas atas dari pola menyentuh kordinat 0.6295/0.6288 dimana batas yang lebih rendah berada sepanjang
Rangka waktu M5 dan M15 mungkin memiliki lebih dari titik entri yang keliru.
Open chart in a new window


