

Pola sebenarnya

Bearish Rectangle
was formed on 20.03 at 15:01:31 (UTC+0)
signal strength 1 of 5
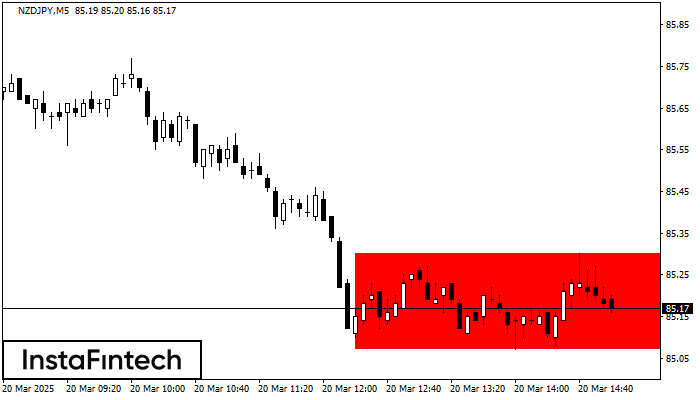
According to the chart of M5, NZDJPY formed the Bearish Rectangle which is a pattern of a trend continuation. The pattern is contained within the following borders: lower border 85.07 – 85.07 and upper border 85.30 – 85.30. In case the lower border is broken, the instrument is likely to follow the downward trend.
The M5 and M15 time frames may have more false entry points.
- All
- All
- Bearish Rectangle
- Bearish Symmetrical Triangle
- Bearish Symmetrical Triangle
- Bullish Rectangle
- Double Top
- Double Top
- Triple Bottom
- Triple Bottom
- Triple Top
- Triple Top
- All
- All
- Buy
- Sale
- All
- 1
- 2
- 3
- 4
- 5
Segitiga Simetris Bullish
was formed on 21.03 at 20:20:31 (UTC+0)
signal strength 1 of 5

Menurut Grafik dari M5, #GOOG dibentuk pola Segitiga Simetris Bullish, yang menunjukkan tren akan berlanjut. Deksripsi. Batas atas dari pola menyentuh kordinat 165.68/165.13 dimana batas yang lebih rendah berada sepanjang
Rangka waktu M5 dan M15 mungkin memiliki lebih dari titik entri yang keliru.
Open chart in a new window
Teratas Ganda
was formed on 21.03 at 20:10:26 (UTC+0)
signal strength 1 of 5
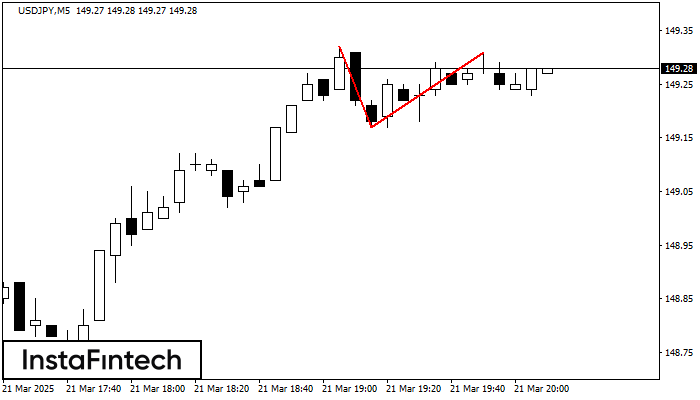
Pada grafik USDJPY M5 pola reversal Teratas Ganda telah terbentuk. Karakteristik: batas atas 149.31; batas bawah 149.17; lebar pola 14 poin. Sinyal: tembusan ke batas bawah akan menyebabkan kelanjutan tren
Rangka waktu M5 dan M15 mungkin memiliki lebih dari titik entri yang keliru.
Open chart in a new window
Teratas Ganda
was formed on 21.03 at 20:00:35 (UTC+0)
signal strength 1 of 5
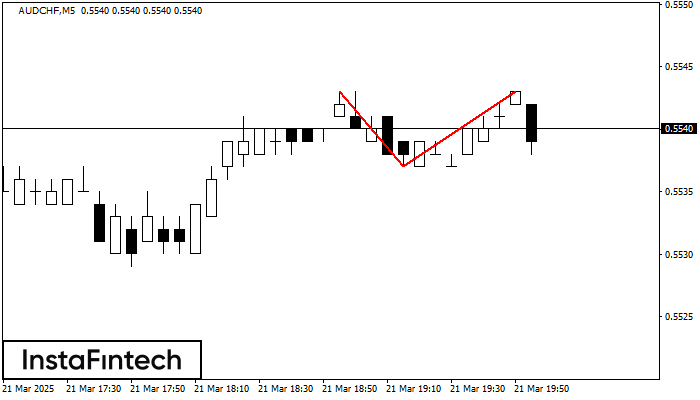
Pola reversal Teratas Ganda telah terbentuk pada AUDCHF M5. Karakteristik: batas atas 0.5543; batas bawah 0.5537; lebar pola 6 poin. Transaksi jual lebih baik dibuka di bawah batas bawah 0.5537
Rangka waktu M5 dan M15 mungkin memiliki lebih dari titik entri yang keliru.
Open chart in a new window


