

Pola sebenarnya

Triple Bottom
was formed on 20.03 at 13:39:49 (UTC+0)
signal strength 1 of 5
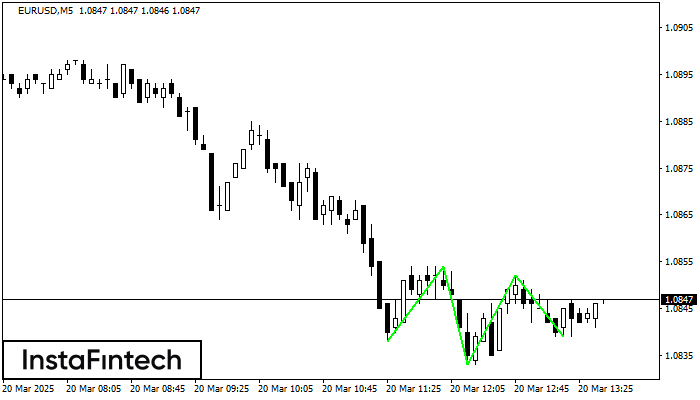
The Triple Bottom pattern has formed on the chart of EURUSD M5. Features of the pattern: The lower line of the pattern has coordinates 1.0854 with the upper limit 1.0854/1.0852, the projection of the width is 16 points. The formation of the Triple Bottom pattern most likely indicates a change in the trend from downward to upward. This means that in the event of a breakdown of the resistance level 1.0838, the price is most likely to continue the upward movement.
The M5 and M15 time frames may have more false entry points.
Figure
- All
Instrument
- All
- Bearish Rectangle
- Bearish Symmetrical Triangle
- Bearish Symmetrical Triangle
- Bullish Rectangle
- Double Top
- Double Top
- Triple Bottom
- Triple Bottom
- Triple Top
- Triple Top
Timeframe
- All
Trend
- All
- Buy
- Sale
Signal Strength
- All
- 1
- 2
- 3
- 4
- 5


