

Pola sebenarnya

Bearish Symmetrical Triangle
was formed on 20.03 at 13:15:51 (UTC+0)
signal strength 1 of 5
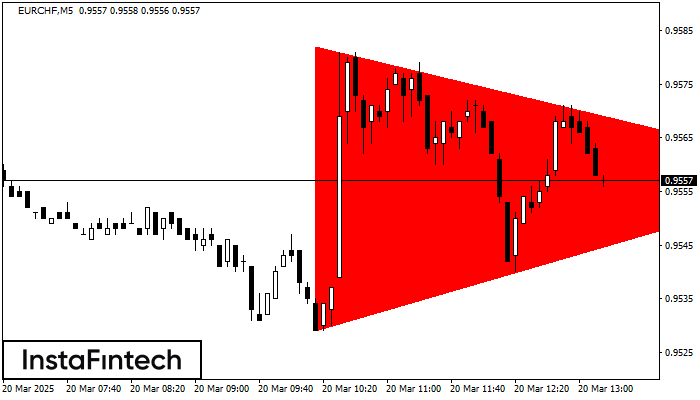
According to the chart of M5, EURCHF formed the Bearish Symmetrical Triangle pattern. Description: The lower border is 0.9529/0.9558 and upper border is 0.9582/0.9558. The pattern width is measured on the chart at -53 pips. The formation of the Bearish Symmetrical Triangle pattern evidently signals a continuation of the downward trend. In other words, if the scenario comes true and EURCHF breaches the lower border, the price could continue its move toward 0.9543.
The M5 and M15 time frames may have more false entry points.
Lihat juga
- All
- All
- Bearish Rectangle
- Bearish Symmetrical Triangle
- Bearish Symmetrical Triangle
- Bullish Rectangle
- Double Top
- Double Top
- Triple Bottom
- Triple Bottom
- Triple Top
- Triple Top
- All
- All
- Buy
- Sale
- All
- 1
- 2
- 3
- 4
- 5
Persegi Bullish
was formed on 21.03 at 20:55:25 (UTC+0)
signal strength 1 of 5
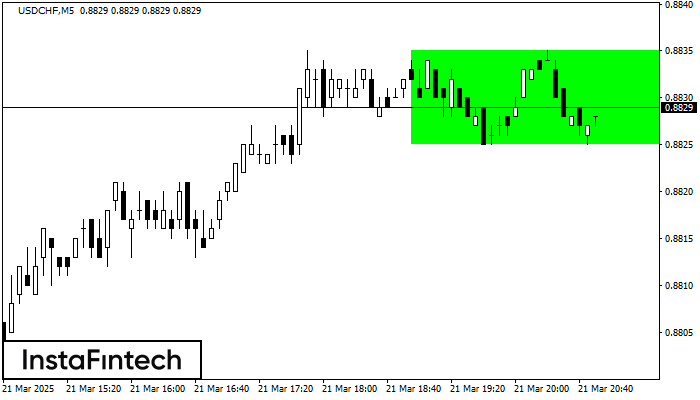
Menurut grafik dari M5, USDCHF terbentuk Persegi Bullish yang merupakan pola dari kelanjutan tren. Pola terkandung dalam batas berikut: batas yang lebih rendah 0.8825 – 0.8825 dan batas atas 0.8835
Rangka waktu M5 dan M15 mungkin memiliki lebih dari titik entri yang keliru.
Open chart in a new window
Teratas Triple
was formed on 21.03 at 20:55:09 (UTC+0)
signal strength 1 of 5
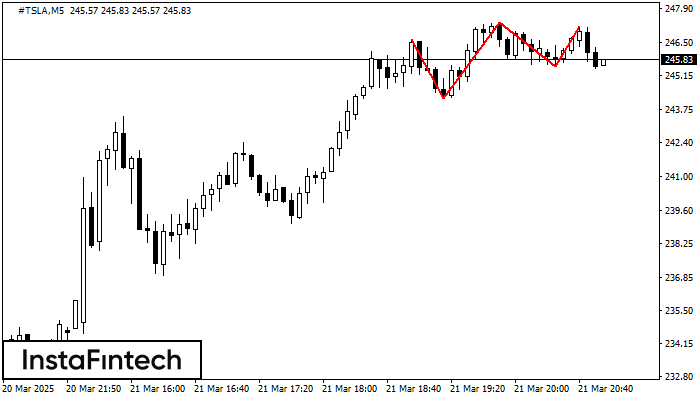
Pola Teratas Triple telah terbentuk pada grafik #TSLA M5. Fitur-fitur pola: perbatasan memiliki sudut yang naik; batas bawah pola memiliki koordinat 244.22/245.52 dengan batas atas 246.65/247.16; proyeksi lebar adalah
Rangka waktu M5 dan M15 mungkin memiliki lebih dari titik entri yang keliru.
Open chart in a new window
Teratas Triple
was formed on 21.03 at 20:55:01 (UTC+0)
signal strength 1 of 5

Pola Teratas Triple telah terbentuk pada grafik instrumen trading #TSLA M5. Pola tersebut merupakan pola reversal menampilkan karakteristik berikut: level resistance -51, levek support -130, dan lebar pola 243. Prakiraan
Rangka waktu M5 dan M15 mungkin memiliki lebih dari titik entri yang keliru.
Open chart in a new window


